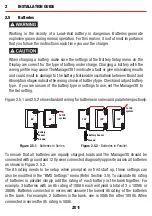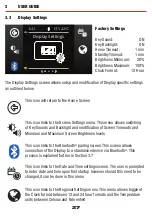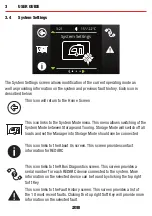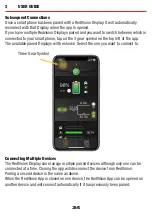
3
USER GUIDE
5A
35A
30A
13.2V
25°C
75W
150Wh
Boost
BMS Information
The BMS information screen provides
information on charge stage, current
flow, State of Charge (SoC), solar
input and battery status*
2
.
The Soft Keys on the right link to
performance logs for SoC/Day, SoC/
Hour and Solar Power input. The
Soft Key on the left links to the
Charging Source information page.
Pushing the down arrow displays
the Distribution Box Info. screen*
3
State of Charge logs
The State of Charge log screens
detail either the SoC on the hour
for the previous 24 hours (State of
Charge per Hour) or the maximum
and minimum SoC each day for the
previous 30 days. Pushing the Left
and Right buttons at this screen will
cycle through the logs, displaying the
information at the top of the graph.
State of Charge per Day
19 Jul: 93% - 96%
Solar Energy per Day
19 Jul: 150Wh
Solar Power input log
The Solar Power input log keeps
track of the Solar Power generated
per day for the previous 7 days.
Pushing the Left and Right buttons
at this screen will cycle through the
logs, displaying the information at the
top of the graph.
*
2
When used with a REDARC MANAGER system.
*
3
When used with a REDARC RedVision Distribution Box.
26

