Ameba-D Application Note
Application Note All information provided in this document is subject to legal disclaimers. © REALTEK 2020. All rights reserved.
15
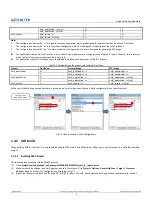
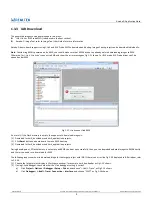
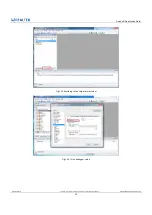
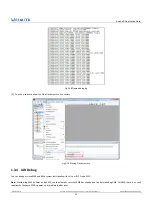
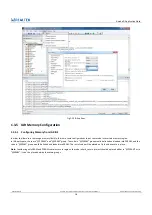
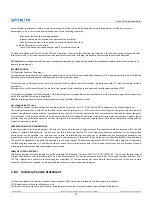
Fig 1-21 Toggle breakpoint
(5)
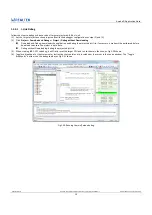
You can trace code step by step with “Step Into” or “Go” until triggering a breakpoint. These function buttons are available on toolbar.
1.3.4.2
RLX Probe Debug
Follow the steps to debug and trace code of target project with IAR by RLX Probe:
(1)
Set the target project as active project and verify the debugger configurations as step (1) and step (3).
(2)
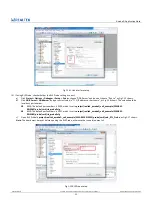
Click
Project
>
Attach to Running Target
.
(3)
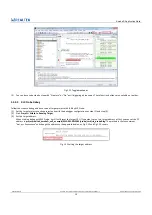
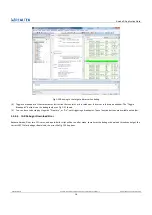
Set the target address.
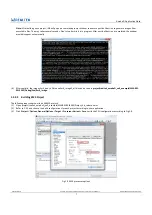
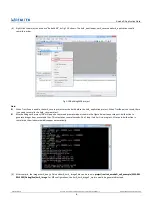
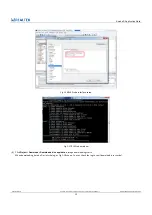
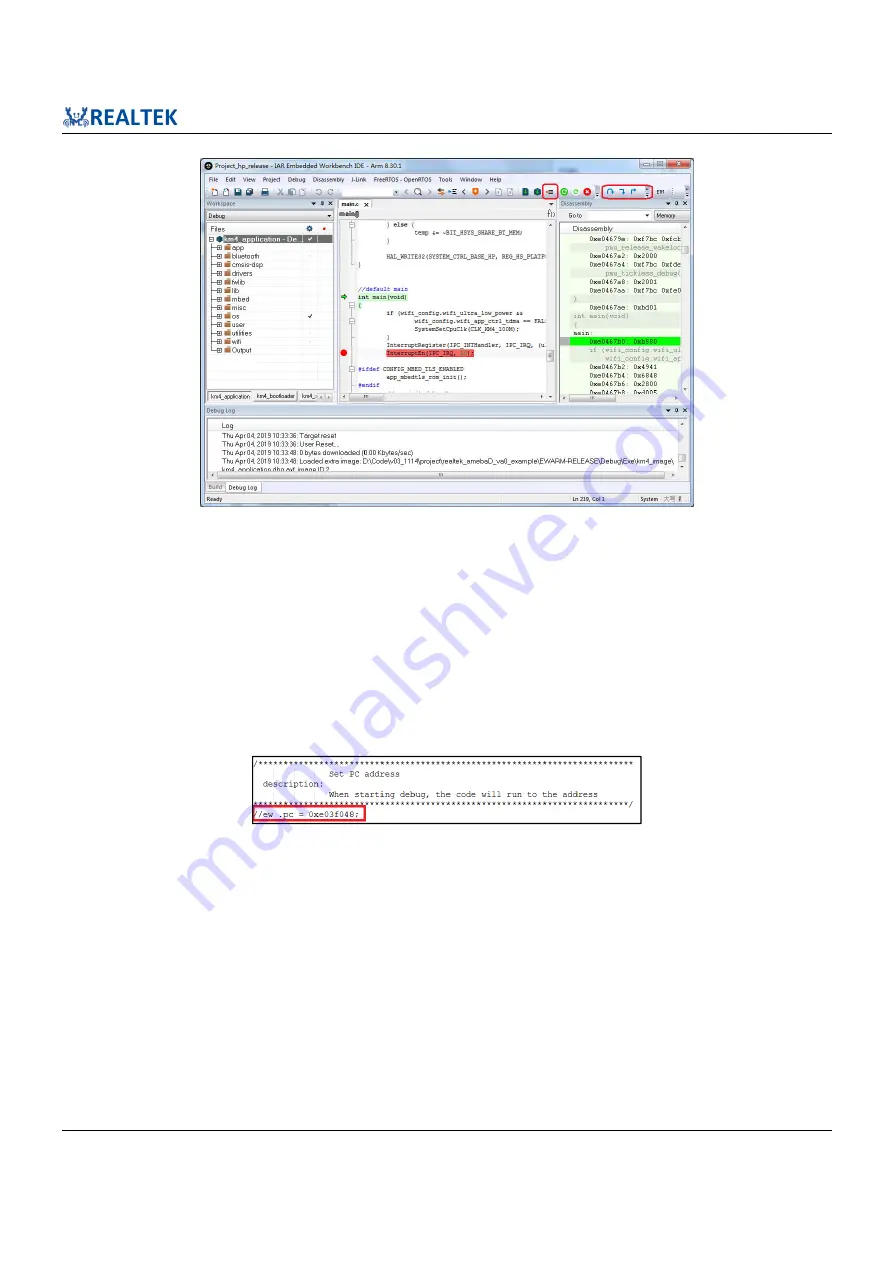
When starting debug with RLX Probe, it will firstly reset the target CPU. If you want to run to a target address at first, you can set the PC
address in
project\realtek_amebaD_va0_example\EWARM-RELEASE\probe\cm4\rlx_probe0.cfg.
The method is that uncomment
“ew .pc = 0xxxxxxxxx” and change the address to the appointed value, as Fig 1-22 and Fig 1-23 shows.
Fig 1-22 Setting the target address

