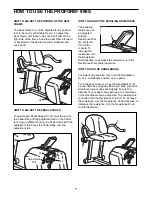
DIAGRAM OF THE CONSOLE
DESCRIPTION OF THE CONSOLE
The innovative console offers a manual mode and
three pacer programs. The pacer programs are
designed to help you achieve specific exercise goals
by pacing your exercise. The programs include a
stamina-building Interval program, an Aerobic
program, and a special Fat Burn program. Whether
you select the manual mode or one of the three pacer
programs, the consoleÕs six monitor modes will
provide continuous exercise feedback during your
workouts.
DESCRIPTION OF THE MONITOR MODES
¥ SpeedÑThis mode shows your pedaling pace, in
miles per hour.
¥ TimeÑIf you select the manual mode, this mode
will count up the length of time you have exercised.
If you select one of the three pacer programs, this
mode will count down the time remaining in the
program. Note: If you stop exercising, the time
mode will pause after a few seconds.
¥ DistanceÑThis mode shows the total distance you
have pedaled, up to 99.99 miles. The display will
then reset to zero and continue counting.
¥ Fat calories (FAT CALS)ÑThis mode shows the
approximate number of fat calories you have
burned. (See FAT BURNING on page 10 for an
explanation of fat calories.)
¥ Calories (CALS)ÑThis mode shows the approxi-
mate number of calories you have burned. (This
number includes both
fat
calories and
carbohydrate
calories. See FAT BURNING on page 10.)
¥ ScanÑThis mode displays the calories, fat calories,
speed, time, and distance modes, for 5 seconds
each, in a repeating cycle.
HOW THE PACER PROGRAMS OPERATE
When you use a
pacer program,
two columns of
bars will appear in
the display. The
left column will
show a target
pace; the right
column will show
your actual
pedaling pace. The
target pace will change periodically during the
program; as the target pace changes, simply adjust
your pedaling pace to keep both columns at the same
height.
Important: The target pace is a
goal
pace.
Your actual pace may be slower than the target
pace, especially during the first few months of
your exercise program. Be sure to exercise at a
pace that is comfortable for you.
The graphs at the bottom of the console show how the
target pace will change during the programs. Look at
the graphs for a moment (see the drawing at the left).
Each graph is divided into ten columns, with six bars in
each column. The columns represent two-minute time
periods, and the red bars show what the target pace
will be. In the first column of the Interval graph, for
example, there is one red bar. This shows that during
the first two minutes of the Interval program, the target
pace will be about 5 miles per hour (see the scale at
the left end of the graph). In the second column there
are five red bars. This shows that during the second
two-minute time period, the target pace will be about
25 miles per hour. Note: Because there are ten two-
minute periods, each program will last for twenty
minutes.
8
Target Pace Actual Pace
Summary of Contents for 831.288300
Page 13: ...13 NOTES ...


