


39
© 2013 PreSens Precision Sensing GmbH
Fibox 4 & Fibox 4 trace
Operation
successfully scanned!”. The respective sensor will be activated and is shown in the status
bar. Now you can start measurements with the sensor.
: Start / Stop the measurement.
According to your measurement settings a single scan or interval measurement will be
started. Pressing the button again will stop the measurement.
: Go back to Simple view.
: Display the measurement graph.
Pressing the button will switch to the graphical presentation of the currently taken
measurements (see chapter 4.5.3).
: Go back to the main menu screen.
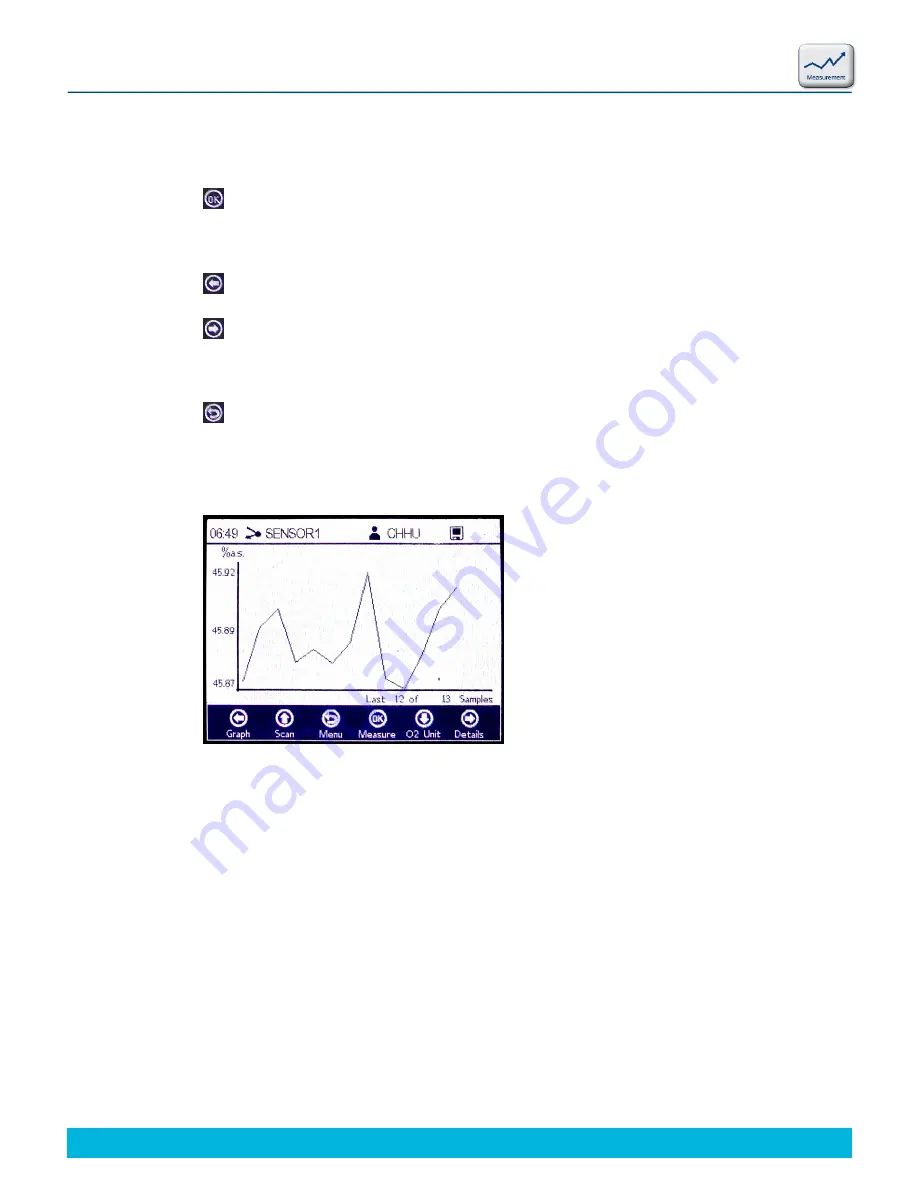
4.5.3 Graph Screen
The oxygen values of the current measurement session are displayed in a graph in the
previously selected oxygen unit. In the lower right of the screen you can see how many
measurement points of the total number of measurement points are displayed in the graph; in
the lower left a progress bar shows (especially with large measurement files) the progress of
data being analyzed. In case you are about to display a large measurement file a pop-up
window appears (see Fig. 55). Though only the last 248 measurements are displayed it can
take some time, as the whole measurement file has to be analyzed to determine which
measurement points have been taken with the currently selected sensor. Select
No
to return
to the current measurement graph. Selecting
Yes
will show the last 248 measurement points
of the currently selected measurement file.
Fig. 54
Graph screen
Summary of Contents for Fibox 4 trace
Page 1: ...Fibox 4 Fibox 4 trace Fiber optic oxygen transmitters TRANSMITTERS Instruction Manual...
Page 2: ......
Page 4: ......
Page 7: ......