5
www.phywe.com, © All rights reserved
12620-09 and 12620-10 / 2715
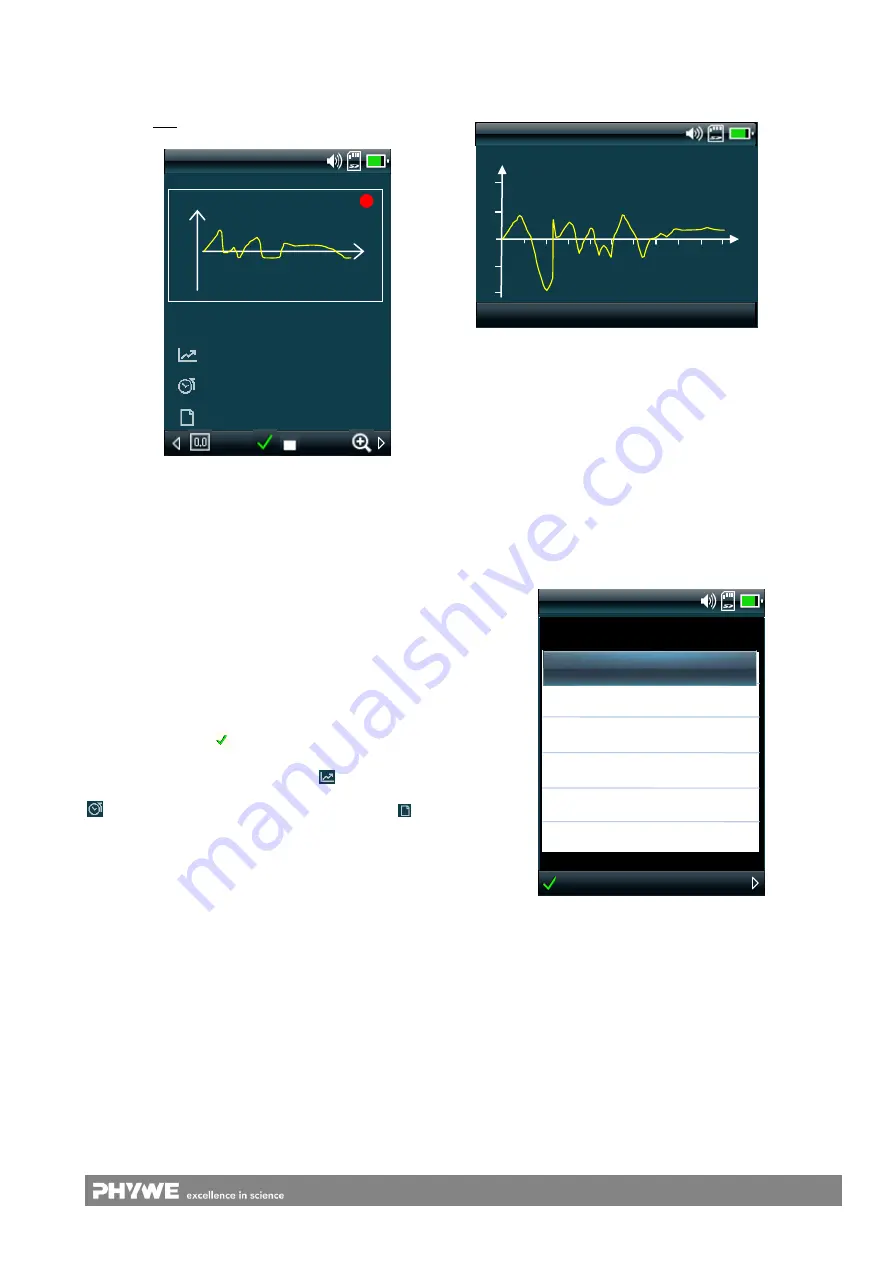
During the measurement, the measurement curve can be
displayed and observed in the data display window by way of
the right arrow key
► (Fig. 9). The left arrow key ◄ leads
you back to the main screen. The data display window can
be opened only during a running measurement.
The measuring channel can be selected and viewed sepa-
rately in the data display window by way of the arrow
keys
▲▼.
The right arrow button
► can be used to zoom the Y-scaling.
In doing so, the values of the Y-axis will be divided in half.
Depending on the sensor, this can be performed up to three
times.
Depending on the selected measuring channel, the associ-
ated graph, which is currently being recorded, is displayed in
yellow in the main field and a red dot flashes in the upper
right-hand corner. The dot disappears when the measure-
ment is stopped with
.
In the minor field, the upper value indicates the current
measuring channel
. The value for
indicates the sam-
pling rate (logging) that can be set in the "Datalogger" menu.
indicates the duration of the measurement and
shows
the name of the measurement.
For every series of measurements, a separate file will be
stored on the memory card. The file name consists of the
date and a running counter: YYMMDDxx.mli (xx = 00
…99).
Ensure that the date and time are set in the Cobra4 Mobile-
Link. This can be checked and, if needed, changed in the
"Setup" menu.
After the completion of the measurement data recording
process, the data can be transferred to the evaluation soft-
ware "measure" where they can be represented and proc-
essed in graphical form. Either the USB interface or a card
reader and the SD card can be used for the data import. The
format of the measurement value file enables it to be im-
ported into a spreadsheet program, e.g. Excel.
If the device is rotated to the left by 90° (i.e. anti-clockwise)
while the data display window is active, the graph will be
enlarged.
Rotating the device to the right (i.e. clockwise), the original
display will be restored as shown in Fig. 9.
5.4
Control menu
The control menu of the Cora4 Mobile-Link 2 is structured as
shown in Fig. 14.
It can be called up by way of the arrow key
in the main
screen and it is subdivided into the following blocks (Fig. 12).
Fig. 11: Graph in the landscape format
Fig. 10: Display without a connected Cobra4 Sensor-Unit in
the recording mode of the data display
Fig. 12: Display of the control menu
Acceleration
t/s
Menu
Sensor
Datalogger
Zero
Calibration
Setup
Utilities
Sensor
Acceleration
2
1
0
-1
-2
ax / g
t / s
1 2 4 5 6 7 8 9 10 11
Acceleration
ax
−0.01 g
50 ms
00:01:30
13010101 .mli
ax/g
2 –
1 –
0 –
- 1 –
- 2 –


