26
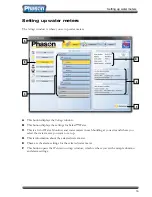
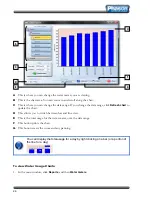
A
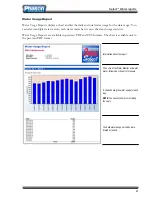
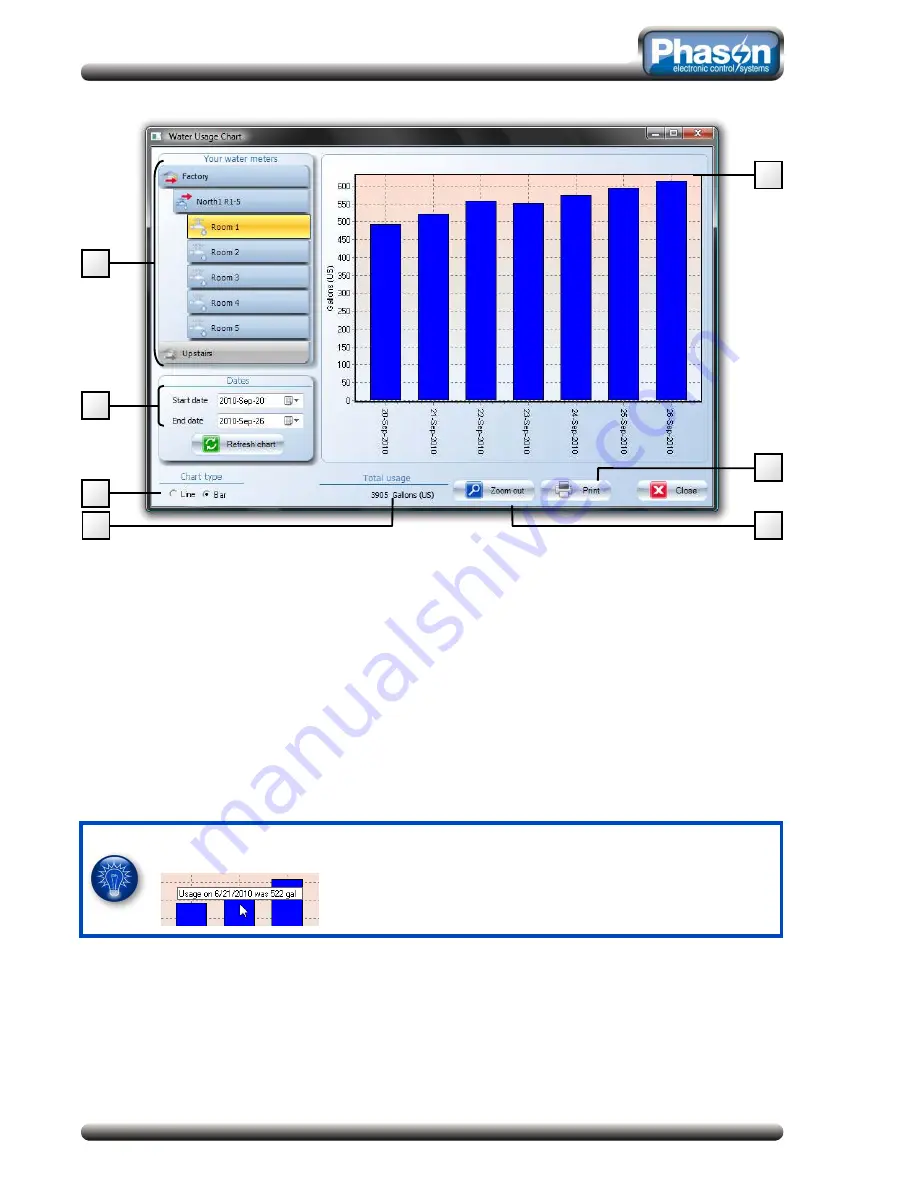
This is where you can change the water meter you are viewing.
B
This is the chart area. You can zoom in and scroll along the chart.
C
This is where you can change the date range. If you change the date range, click
Refresh chart
to
update the chart.
D
This allows you to switch between bar and line view.
E
This is the total usage for the water meter, over the date range.
F
This button prints the chart.
G
This button resets the zoom and any panning.
You can display the total usage for a day by right clicking on a bar (or a portion of
the line for a day).
To view Water Usage Charts
1.
In the main window, click
Reports
, and then
Water meters
.
C
F
H
A
D
G
E

