© Bueno Systems, Inc. • TSL1401-DB (2009.10.01)
Page 15 of 52
Types are “Off”, “Normal”, and “Strobed”. Normal mode means that the LED is on for the
duration of each exposure at a brightness level that can be set in the numerical window. In
strobed mode, the brightness level is fixed at maximum brightness, with the duration being the
adjustable factor.
•
Scope Window:
This window shows the analog output of each pixel in real time. The horizontal
magenta lines represent high and low thresholds for binary pixel acquisition, similar to the BS2
acquisition discussed in the previous section, but controllable. In normal comparator-style
acquisition, the separation between these lines is the comparator hysteresis. These lines can be
moved up and down by positioning the cursor between them and dragging them with the left
mouse button held down. The separation (hysteresis) can also be adjusted, by dragging with the
right mouse button held down. The vertical cyan-colored lines determine the area of interest for
image analysis. They can be dragged left and right, individually, with the left mouse button held
down. The yellow line – and any yellow feature, for that matter – represents the result of an
image analysis measurement.
•
Image Brightness Window:
The narrow window below the scope window is divided into three
slices. The bottom slice shows the instantaneous image brightness for each pixel as a gray level.
The next slice up, shows which pixels register as “light” pixels after thresholding. The top slice is
used to show image analysis results (in yellow) when those results include location or count
information.
•
Binary Acquisition Controls:
These adjust the threshold types and values and are discussed in
their own section below. Suffice it to say here that changes to these controls are reflected in the
magenta lines displayed in the scope window.
•
Image Analysis Controls:
These controls make it easy to measure various features in an
acquired image to test what might work or not work in your application. They are discussed in
detail in their own section to follow. The value in the window after “equals” (in yellow) is the
numerical result to which the yellow graphics coincide. In the example above, this is the value of
the first pixel in the region defined by “between 1 and 255”. The “Code” button will be used in a
future rev of this program to write a PBASIC program for you that performs the scan acquisitions
and performs the image analysis that you’ve selected.
Focus
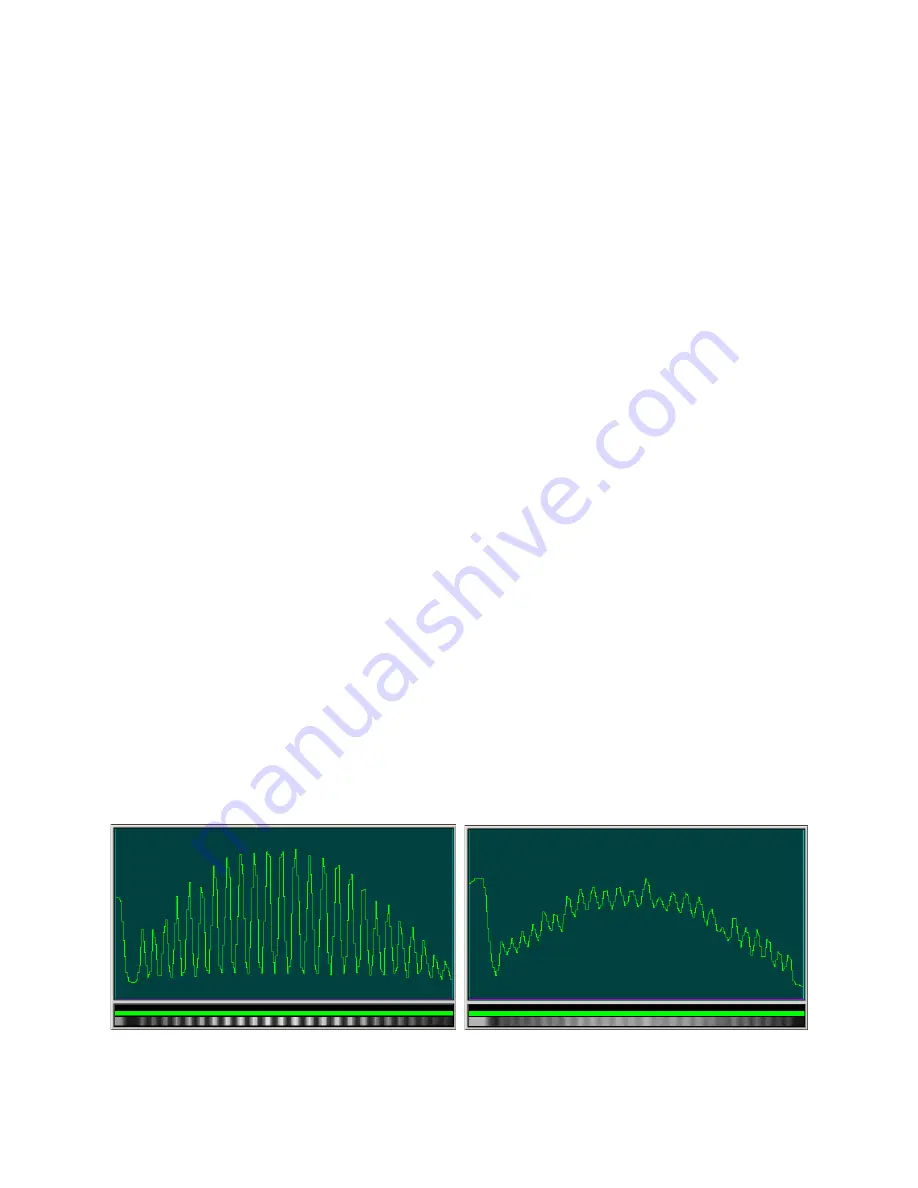
The monitor program enables almost instant feedback for focusing the lens. Below are two screenshots:
one of a backlit comb that’s in focus, and one that’s not. Notice the sharper edges and more pronounced
detail in the in-focus image. This is what you need to strive for. By screwing the lens in and out, while
watching the scope window, you will be able to maximize the sharpness of your image to obtain the best
– and most repeatable – results.
Backlit Comb in Focus Backlit Comb Out of Focus


