


Using the Navigation Wizard
2-16
7800-A2-GB28-80
May 1999
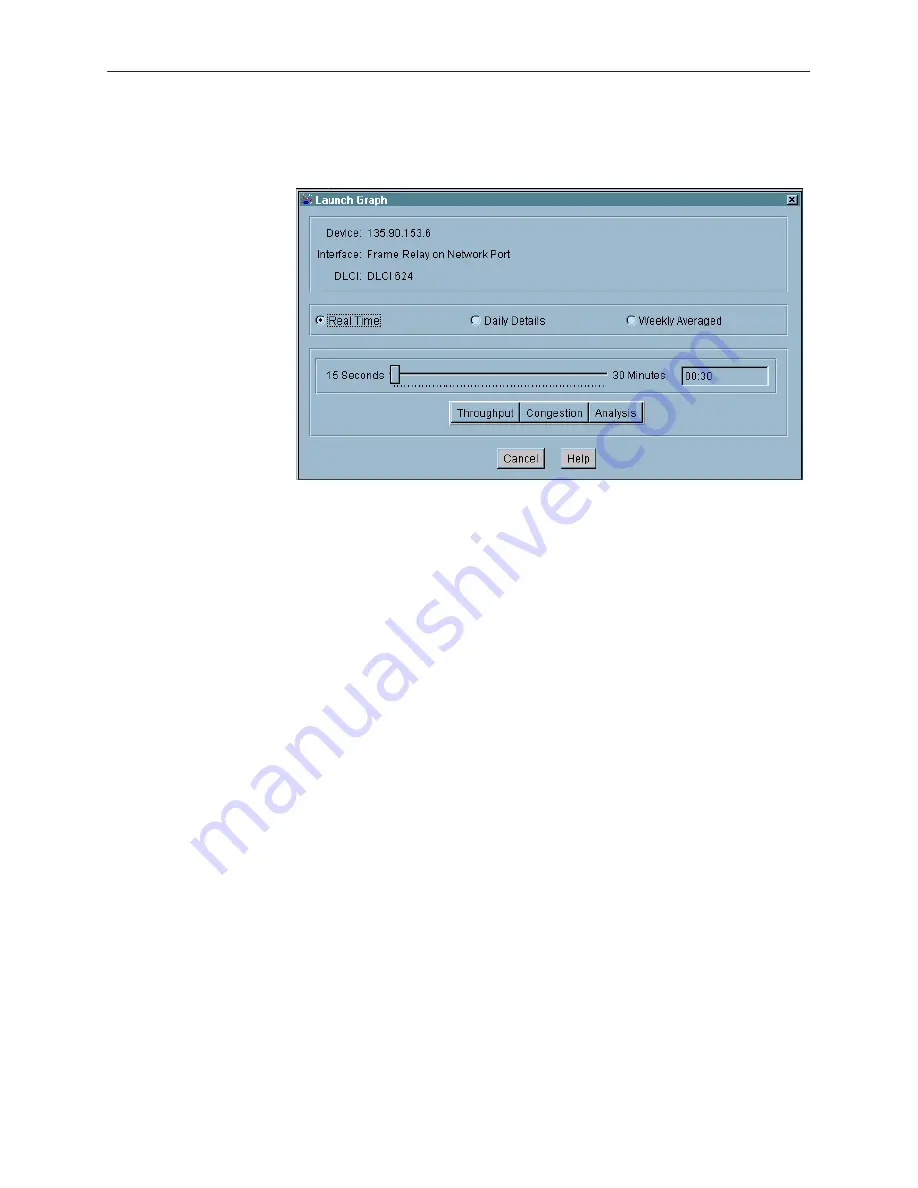
2. Select a DLCI, click the right mouse button, and select Launch Graph from
the drop-down menu.
The Launch Graph dialog specifies the device, interface, and DLCI
(if applicable) that you selected, gives you the option of selecting Real Time
or Historical Charts (Daily Details and Weekly Averaged), and lists the chart
types available for the interface or DLCI you selected.
3. Ensure that the Real Time option is enabled. This is the default.
— Drag the slider. The value selected is displayed in the text entry box,
which is positioned to the right of the slider.
— Click on the line to either side of the slider. This increments or
decrements the value by one second and the value is displayed in the
text entry box to the right.
— Enter a value in the text entry box, which is located to the right of the
slider.
NOTE:
This polling frequency affects the chart type that you selected in this
dialog box only. Refer to
Setting the Real Time Polling Frequency
on
page 2-14.
4. Click on the chart type button (Throughput, Congestion, or Analysis) to open
the Real Time Chart dialog for the selected view.
See Chapter 3,
Using Real Time Charts
, for information on managing
performance using these charts.
See Chapter 6,
Diagnostic Tests
, for information on running tests.


