background image

04/26/02 

24 

Revision 1.11 

that all parameters and translations values are correct for 
postprocessing.  Normally this is done automatically but it is a good idea 
to verify this.  Open 

HYPACK for Windows 6.4 / Geodesy

 and check that 

each parameter is correct. 


For the next segment, the vessel should be moved to the work site or 
open water in order to establish start and end points for a test survey 
line. 


Line Setup 


1- Under 

HYPACK for Windows 6.4 / Preparation / Design / Planned Line / 

New LNW File

, enter the XY of the starting and ending points of a 

proposed center line.  NOTE: If these points are unknown, navigate to 
the approximate locations, start the HYPACK 

Survey

 program, and 

record the coordinates when on location. 

2- Under 

HYPACK for Windows 6.4 / Preparation / Design / Planned Line / 

New LNW File

, enter the number of lines to survey and their parallel 

offsets.  NOTE:  Offsets are determined primarily by water depth.  
Provisions should be made for at least a 10% overlap in coverage 
between adjacent lines.  For example: If the water depth averages 30 
meters, the coverage will average 60 meters across the bottom.  Line 
offsets should, therefore,  be no more than 54 meters apart.  Be aware 
that allowances must be made for closer line spacing in areas subject to 
large changes in depth. 

3-  Name the line file with a .lnw extension and save it. 
4- 

Save


the

 configuration and 

Make Current

5-  Surveying (Data Collection) Start the surveying program (

HYPACK for 

Windows 6.4 / Survey).

  Several windows may appear but the main 

window, the “Area Map” will display current position.  If the vessel is in 
the area of the survey lines defined previously, they will also be visible.   
To “zoom in” press the “-“ key to “zoom out”, press “+” (using the Shift 
key).  The “Data Display” window should also be visible and all sensor 
inputs should be updating. 

6- As the “Beginning of Line” is approached, logging will begin 

automatically when the vessel comes within the preset distance (under 

Survey / Navigation / Parameters

).  A status indicator in the Data Display 

labeled “Offline” will change to “Online” (in red) at this time.  Data logging 
will revert to “Offline” as the end of the line is crossed.  This automatic 
feature may be overridden by the CNTRL S key combination to start 
recording and CNTRL E to end.  It may also be disabled completely 
under 

Survey / Navigation / Parameters.


Once data collection begins, HYPACK assigns a Line File Name to it.  
This is displayed in the Data Display window.  This file name should be 

Summary of Contents for ECHOSCAN

Page 1: ...Up Procedure 20 Example Survey System Configuration 21 HYPACK 21 ECHOSCAN Setup 21 HYSWEEP 25 Non Standard System Configurations 26 COMMUNICATION CPU Dip Switch Settings 29 MULTIBEAM CALIBRATION 31 B...

Page 2: ...ow noise or cavitation 30 independent beams fan out from the transducer to cover a swath equal to twice the water depth The transducer is positively buoyant for easy recovery should it impact with flo...

Page 3: ...e additional board process side scan backscatter imagery All 11 boards are identical and interchangeable See Technical Manual for details Real time data quality verification is provided in the form of...

Page 4: ...cm Roll Pitch Accuracy 0 05 w optional ODMS 05 sensor Maximum Tilt Angle 45 self calibrating w ODMS 05 sensor Sidelobe Suppression 30db Per Channel Sensitivity 197 db re 1 V Pa Source Level 225 db re...

Page 5: ...ceive GPS and compass information to assist and optimize operation while in turns The Junction Box is designed to handle this and other data interchanges System Components A diagram of the complete sy...

Page 6: ...ate is controlled by the update rate of the echo sounder Power Supply Considerations The SPU is available in either AC or DC versions The Junction Box however operates only on 24 VDC In most cases the...

Page 7: ...is safe and where it will produce the least amount of drag and cavitation at survey speeds Careful consideration must also be given to the method of deployment and retrieval In its fully deployed pos...

Page 8: ...ssary to fabricate a mount for transducer are labeled in the drawing Inside dimensions of the pole must be no less than 2 5 inches to allow for passage of the cables Further information on transducer...

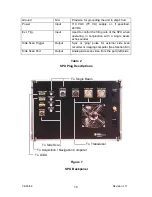
Page 9: ...ions The Signal Processing Unit back panel connectors are described in Table 2 Refer to Figure 7 Designation Direction Description RS232 Control Input Output Normally connected to the LCDU this RS232...

Page 10: ...the SPU when operating in conjunction with a single beam echo sounder Side Scan Trigger Output Sync or ping pulse for external side scan recorder or imaging computer See Section 6 3 Side Scan Port Ou...

Page 11: ...n the Power On switch there are no controls on the production model of the SPU Earlier versions incorporated an Output Power control located on the Transmitter board In this case the ECHOSCAN output l...

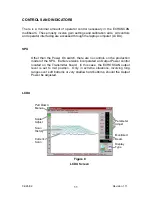
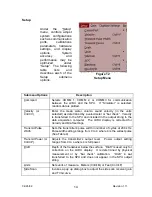
Page 12: ...nto the display with the most current scaled profile in the foreground See Figure 8 Special digitizer controls on the LCDU pull down menus allow the operator to control gain settings and restrict digi...

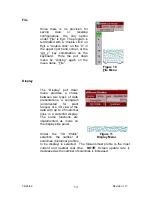
Page 13: ...The Display pull down menu provides a choice between two types of data presentations a sonogram uncorrected for slant ranges or a 3D view of the data with up to 25 historical lines in a waterfall dis...

Page 14: ...and included in the output string to the data acquisition computer The LCDU display is corrected for Velocity and Draft settings Transmit Pulse Width Sets the transmitter s pulse width in number of cy...

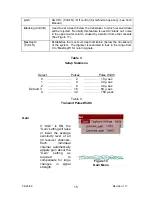
Page 15: ...ximum depth limitation below the transducer of the system The digitizer is restricted to look in the range from 0 to MaxDepth for return signals Table 3 Setup Submenu Gain If AGC is ON the Gain settin...

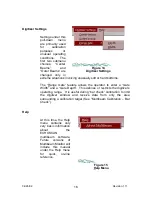
Page 16: ...o enter a Gate Width and a Gate Depth This defines or restricts the digitizer s operating range It is useful during bar check calibration to limit the digitizer window and receive data from only the a...

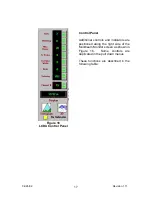
Page 17: ...l controls and indicators are positioned along the right side of the Multibeam Monitor screen as shown in Figure 16 Some controls are duplicated in the pull down menus These functions are described in...

Page 18: ...nsmitter s power level to control the pulse output amplitude Tx Power may also be set in the Setup pull down menu Transmit Power in Table 3 Tx Pulse Width Output Pulse Duration Adjusts the number of c...

Page 19: ...04 26 02 19 Revision 1 11 Blanking aeration Figure 17 Blanking Feature...

Page 20: ...trol Panel as required for optimum performance Too little gain will result in lost returns red lights flashing on the SPU and spikes in the data Too much gain will introduce multipath reflections dept...

Page 21: ...be downloaded from Coastal s web page www coastalo com HYPACK Go to HYPACK for Windows 6 4 Preparation program Select Initialization File New to create a new setup or Open to use one that already exi...

Page 22: ...GPS manual or as a result of the Patch test Measure and type in the horizontal distances between the GPS antenna and the transducer Click OK to return to the Devices Setup window and OK to return to...

Page 23: ...reparation screen select File Save As name the file and save it Before continuing click on Make Current under File menu The next step is to test the drivers to insure that HYPACK is reading them corre...

Page 24: ...therefore be no more than 54 meters apart Be aware that allowances must be made for closer line spacing in areas subject to large changes in depth 3 Name the line file with a lnw extension and save i...

Page 25: ...K 2 Select a line to edit and under Read Options and click on OK Check through each of the four windows looking for spikes in the data recorded from each sensor Remove any obvious errors 3 Select Swee...

Page 26: ...ix defined in the previous step Open the current log file The program will now begin reading all data points and plotting each line 8 When data plotting is complete go to Mapper File name and save the...

Page 27: ...ic energy Increasing the transmit pulse width should improve signals from the outer beams NOTE Increasing transmit pulse width reduces system resolution Adjust this parameter only if other methods fai...

Page 28: ...o the Bottom Tracking be performed only experienced ECHOSCAN system operators Normal default settings are listed below Refer to Table 4_1 for adjustment sequence and direction for various extreme bott...

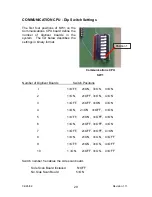
Page 29: ...ry format Number of Digitizer Boards Switch Positions I 1 OFF 2 ON 3 ON 4 ON 2 1 ON 2 OFF 3 ON 4 ON 3 1 OFF 2 OFF 3 ON 4 ON 4 1 ON 2 ON 3 OFF 4 ON 5 1 OFF 2 ON 3 OFF 4 ON 6 1 ON 2 OFF 3 OFF 4 ON 7 1 O...

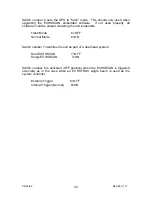
Page 30: ...d rendering the unit inoperable Flash Mode 6 OFF Normal Mode 6 ON Switch number 7 identifies the unit as part of a dual head system Dual ECHOSCAN 7 OFF Single ECHOSCAN 7 ON Switch number 8 is activate...

Page 31: ...to operate with a single beam echo sounder such as the Odom ECHOTRAC it is possible to perform a normal bar check on each simultaneously NOTE Draft and Velocity corrections may vary between the two u...

Page 32: ...ting Even the system constant k is automatically compensated using this method 1 Lower the bar to a depth of 4 meters or 10 feet below the transducer This will be Level 1 2 Pull down the Digitizer Set...

Page 33: ...n evenly distributed magnetic field This may take some trial and error before the best spot is located The best way to establish the optimum location is to observe the boat symbol and its track on the...

Page 34: ...atency 0 1000 ms One 16 bit word Example 00h 00h 03h E8h indicating the time lapsed between the sonar ping to the start of the fourth byte in the output string Sampling Rate HZ One 16 bit word represe...

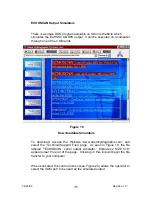
Page 35: ...the Website www odomhydrographic com and select the Technical Support Files page As seen in Figure 19 the file labeled ECHOSCAN serial output simulator Mbout exe SIZE 51K appears near the end of the...

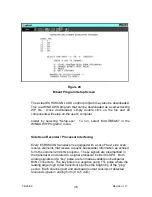
Page 36: ...sducer is equipped with a set of true side scan receive elements that receive acoustic backscatter information as echoed form the common 200 kHz projector These signals are preamplified in the transdu...

Page 37: ...ble with all major side scan processing and recording devices i e Triton ISIS OIC GEOdas Oceanstar SeaSound EPC recorders etc For mode information consult the following web sites http www tritonelics...

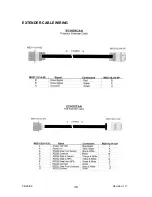
Page 38: ...04 26 02 38 Revision 1 11 EXTENDER CABLE WIRING...

Page 39: ...04 26 02 39 Revision 1 11 TRANSDUCER CABLES...

Page 40: ...04 26 02 40 Revision 1 11...

Page 41: ...04 26 02 41 Revision 1 11...

Page 42: ...04 26 02 42 Revision 1 11 JUNCTION BOX WIRING...

Page 43: ...04 26 02 43 Revision 1 11...

Page 44: ...04 26 02 44 Revision 1 11 HEADING SENSOR WIRING...

Reviews: