68
INDUSTRY
Section 5
Instructions for use
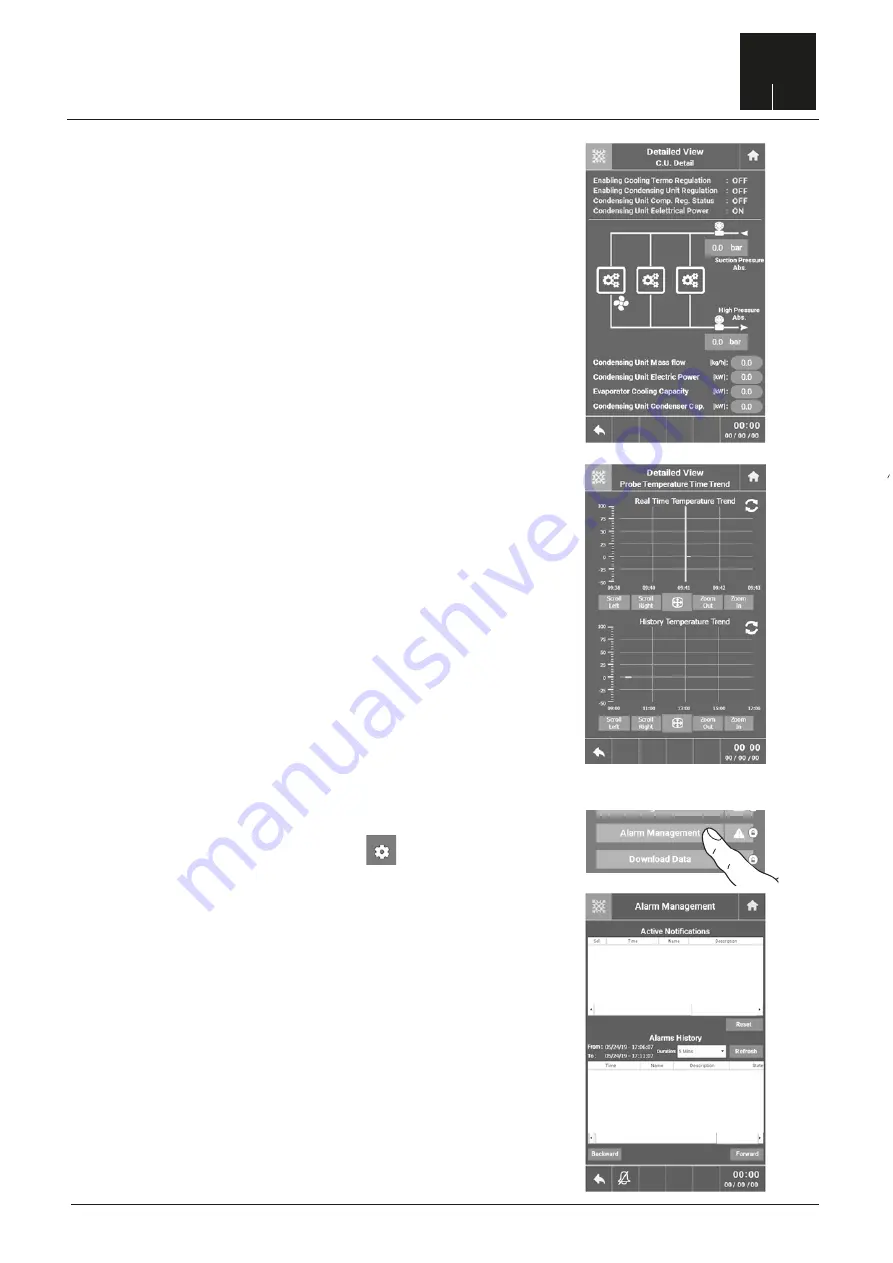
The specific screen of the condensing unit (Figure 46)
allows you to view the adjustment status and enable
the request for refrigeration power and the presence of
electrical energy on the condensing unit.
We can also estimate the following parameters:
• Refrigerant mass flow rate.
• Power absorbed by the condensing unit.
• Power to the evaporator.
• Power to discard on capacitor.
6.2.3 Operation of the condensing unit
The “Temperature trend” screen (Figure 47) allows you
to view two graphs describing the temperature trend
detected by the air probe and core probe. In particular,
• Real Time Temperature Trend: describes in real time
the temperature trend of the core probe and air probe.
On each access to the graph page, it resets.
• History Temperature Trend: this graph allows you to
temporally scroll the temperature trend and display the
history data.
6.2.4 Temperature trend
figure 46
figure 47
6.2.5 Alarms display
figure 49
figure 48
To access the alarms display
menu, on the Home screen press the symbol ,
you access the “Settings” screen, press “Alarm
Management” (Figure 48) to enter the screen.
The screen in Figure 49 appears where the top part in
“Active Notifications” displays all the active alarms in
real time, while the bottom part, “Alarms History”
displays the history of all the equipment alarms.


