4.
Alignment and Measurement
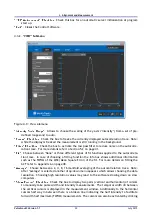
"Transparency" / "Fontsize":
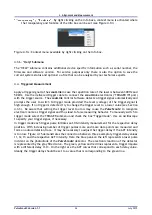
By right clicking on the Info box a context menu is activated where
the transparency and fontsize of the Info box can be set (see Figure 4.14)
Figure 4.14.: Context menu available by right clicking on the Info box.
4.3.6.
"Help" Submenu
The "HELP" submenu contains additional device speci c information such as serial number, the
rmware and software version. For service purposes only there is also the option to save the
current system status and options to a le that can be analyzed by our technical experts.
4.4.
Triggered Measurement
Apply a trigger signal to the
scout
Link
in case the repetition rate of the laser is between 300 Hz and
50 kHz. Use the delivered trigger cable to connect the
scout
Link
electronics ("TRIGGER IN" port)
with the trigger source. The
scout
Link
Control Software detects a trigger signal automatically and
prompts the user to switch to trigger mode provided the level (voltage) of the trigger signal is
high enough. If no trigger is detected try to change the trigger level to a lower value (see Section
4.3.3). Be aware that setting the trigger lever too low may cause the
Pulse
Scout2
to recognize
electronic noise as trigger signal and thus lead to false measuring behavior. To manually switch to
trigger mode select the TRIGGER submenu and check the box "Triggermode". Use an oscilloscope
to specify your trigger signal, if necessary.
In trigger mode each trigger pulse initiates an SHG intensity measurement for the respective delay
position. With increasing number of trigger pulses more and more data points are measured and
form an autocorrelation trace. It may be necessary to adjust the trigger-delay if the ACF intensity
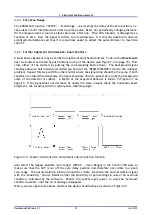
is too low. Figure 4.15 demonstrates the connection between three exemplary trigger-delay values
t1, t2, t3 and the respective ACF intensity. Here the blue peak on the left represents a laser pulse
incident on the photodiode of the
Pulse
Scout2
detector. The electronic reaction of the detector
is represented by the gray lled curve. The green, yellow and red lines represent a trigger impulse
with a different delay t1-t3. On the right are the ACF curves that correspond to each delay value.
Ideally the trigger delay should be set to a value that is corresponding to the green line.
Pulse
Scout2 Version 1.1
34
July 2015

