FISH 4350 / 4380
Installation and Operation Manual
19
NAVMAN
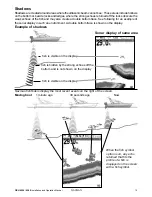
5-1 Sonar display
To show the Sonar display highlight
Sonar
and press :
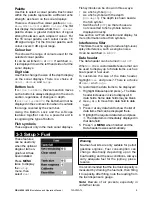
This display scrolls from right (most recent
echoes) to left (oldest echoes). (see section
3-2 Setup > Sonar).
Data header, set up to show
the water temperature, battery
voltage (See section 3-2 Setup
> Sonar)
Colour bar
Depth (medium size digits)
Range
Bottom
Surface
Fish symbols with depth
5-2 Sonar Zoom display
To show the Sonar Zoom display, highlight
Sonar Zoom
and press :
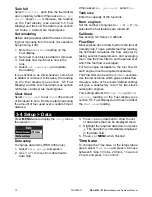
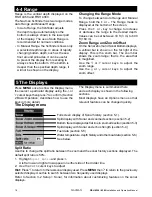
The split display shows the sonar history on the
right side and the zoom section on the left.
The zoom bar on the far right shows the area
that is magni
Þ
ed in the zoom section. See
section 4-4 Range, for information about
adjusting the Zoom Range and Zoom Offset.
Zoom bar
Sonar history
Zoom section
Divider line
5-3 Sonar Bottom display
To show the Sonar Bottom display, highlight
Sonar Bottom
and press .
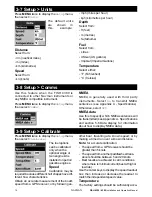
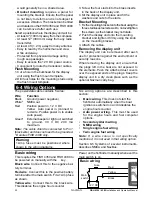
This shows a split display, with the sonar history
on the right side and the zoom section on the
left. The bottom signal is shown as a
ß
at trace
in the centre of the zoom section.
Showing the bottom as a
ß
at trace can make it
easy to compare the echo strengths shown in the
bottom signals. This can help to identify the type
of bottom and objects close to the bottom.
The zoom bar can only indicate the zoom range.
It cannot indicate the zoom offset as this changes
for each sounding displayed on the display. The
zoom bar is
Þ
xed in the middle of the display.
See section 4-4 Range, for information about
adjusting the Zoom Range and Zoom Offset.


