


The Interface Solution Experts
13
TMZ
PC-Programmable MODBUS
Temperature Transmitter
Note:
Once you have configured all parameters, download
to the unit by selecting “Download” in the Transfer
dropdown menu located in the Status Bar. You may
also download by clicking the button in the
Tool Bar.
Trimming
Sensor Trimming–
Sensor Trimming increases
the measurement accuracy of your instrument by
matching the reading of its actual input to either
a calibrated source or the device to which it is
connected. This verifies that the input from the sensor
to the transmitter is being interpreted correctly.
You may trim any point between 0% and 100% along
the scale.
Note that one-point trimming applies an
offset to the sensor reading, while two-point trimming
applies both an offset and a gain.
Follow the steps below in order to perform sensor
trimming.
1. Select either “1 Point” (one-point trimming) or “2
Points” (two-point trimming) by clicking the appropriate
button. Each pair consists of “Set” and “Trim” values.
2. Enter the values that need to be trimmed into the
“Set Value” field and click “Set”.
3. Apply the targeted signal to the input, wait until it
settles and click “Trim” to capture the measured value.
If you chose “2 Points”, repeat the step above for the
second point.
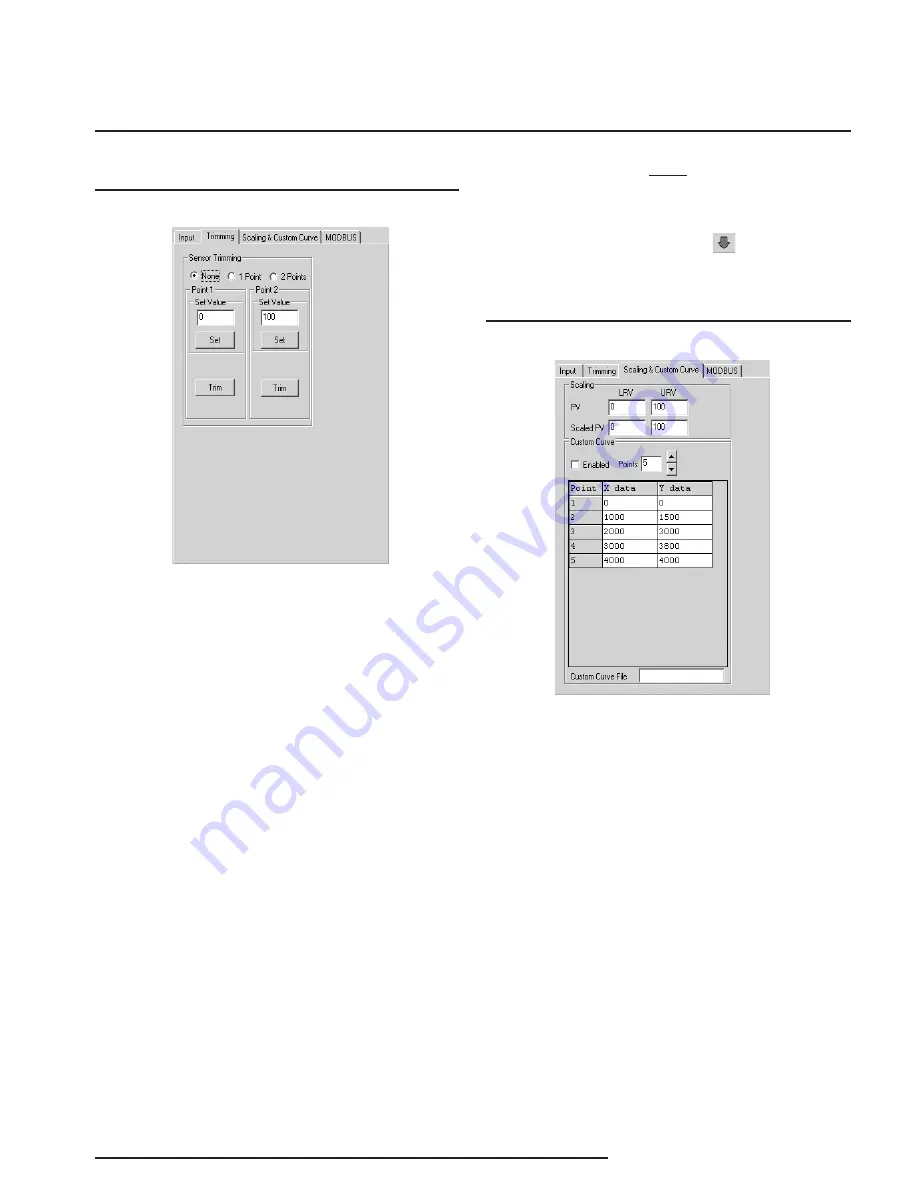
Figure 7.
Trimming Tab
Scaling & Custom Curve
Scaling–
Scaling allows you to take your PV
(Process Variable) reading and manipulate it to a more
customized display range (Scaled PV). PV is the unit
read after selecting your input type. For example,
choosing a mV input would then produce a PV
displayed in mV.
Should you require a Scaled PV, follow the instructions
below.
1. In the “PV” parameter, enter the actual range of
your input type. Place the minimum value in the “LRV”
text box and the maximum value in the “URV” box.
2. In the “Scaled PV” parameter, enter the scale, or
range you require. In the “LRV” text box, enter the
value that you wish displayed when your reading is at
its minimum. In the “URV” text box, place the value to
be displayed when the process variable has reached
maximum.
Figure 8.
Scaling & Custom Curve Tab


