


60 | 120
blue’Log X series
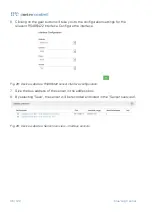
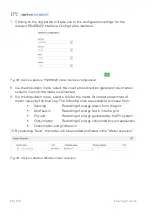
7.
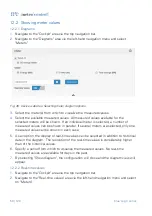
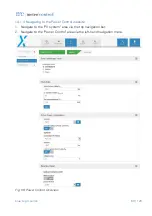
By selecting "Show diagram", the visualization configuration will close and the
diagram view will appear in the same window.
Fig. 47: Device websites: Visualizing the measured data
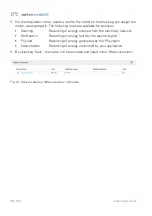
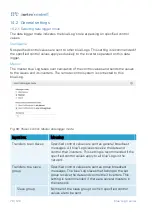
12.3.2
Real-time values
1.
Navigate to the "Cockpit" area via the top navigation bar.
2.
Navigate to the "Real-time values" area via the left-hand navigation menu and select
"Inverters".
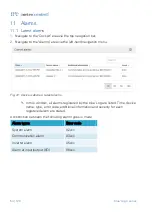
Fig. 48: Device websites: Visualizing the real-time values