


O3® Regional Oximeter
Chapter 4: Operation
www.masimo.com
24
Masimo
To enable/disable Trend View, tap the action menu on the top right corner of the O3
®
Module
window. Press the
Trend
button to enable or disable Trend View.
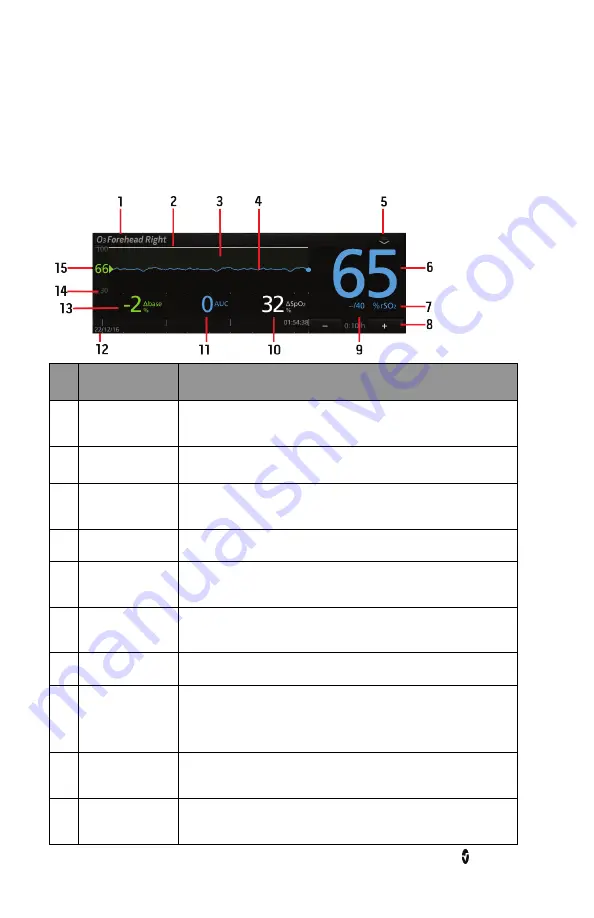
Each sensor display shows a multitude of information about O3
®
Module parameters and
measurements and also allows the user to customize how the information is displayed. The
various portions of a sensor display are outlined in the illustration and each portion is
explained in more detail in the table below.
Ref. Feature
Description
1
Sensor Label
Label identifies the sensor site that corresponds to the application
site of the O3
®
Sensor.
2
SpO
2
Trend Line
Displays SpO
2
level from the peripheral SpO
2
sensor site over time
1
.
3
Δ
SpO
2
Region
Displays the difference between levels of SpO
2
(peripheral SpO
2
sensor site) and rSO
2
of the O3
®
Sensor site over time.
4
rSO
2
Trend Line
Displays rSO
2
level of the O3
®
Sensor site over time.
5
Action Menu
Allows user to change display options and access the site selection
and set baseline menus for each O3
®
Sensor.
6
rSO
2
Value
Indicates the current rSO
2
level of the O3
®
Sensor site. Press the
value to access the rSO
2
menu.
7
%rSO
2
Indicates the unit of measurement for rSO
2
.
8
Time Frame
Configurator
Displays the current time frame of trending shown.
Press “-” to shorten and “+” to lengthen the time frame of the
trending displayed.
9
rSO
2
Alarm Limits Indicates the selected high and low limit values which triggers an
rSO
2
alarm. Press the value to access the rSO
2
menu.
10
Δ
SpO
2
%
Displays the difference between levels of SpO
2
(peripheral SpO
2
sensor site) and rSO
2
of the O3
®
Sensor site.