background image

Sea Scan® Survey Software Manual

22

© 2013 Marine Sonic Technology, Ltd.

3.2.4.7.3.2  Plotter

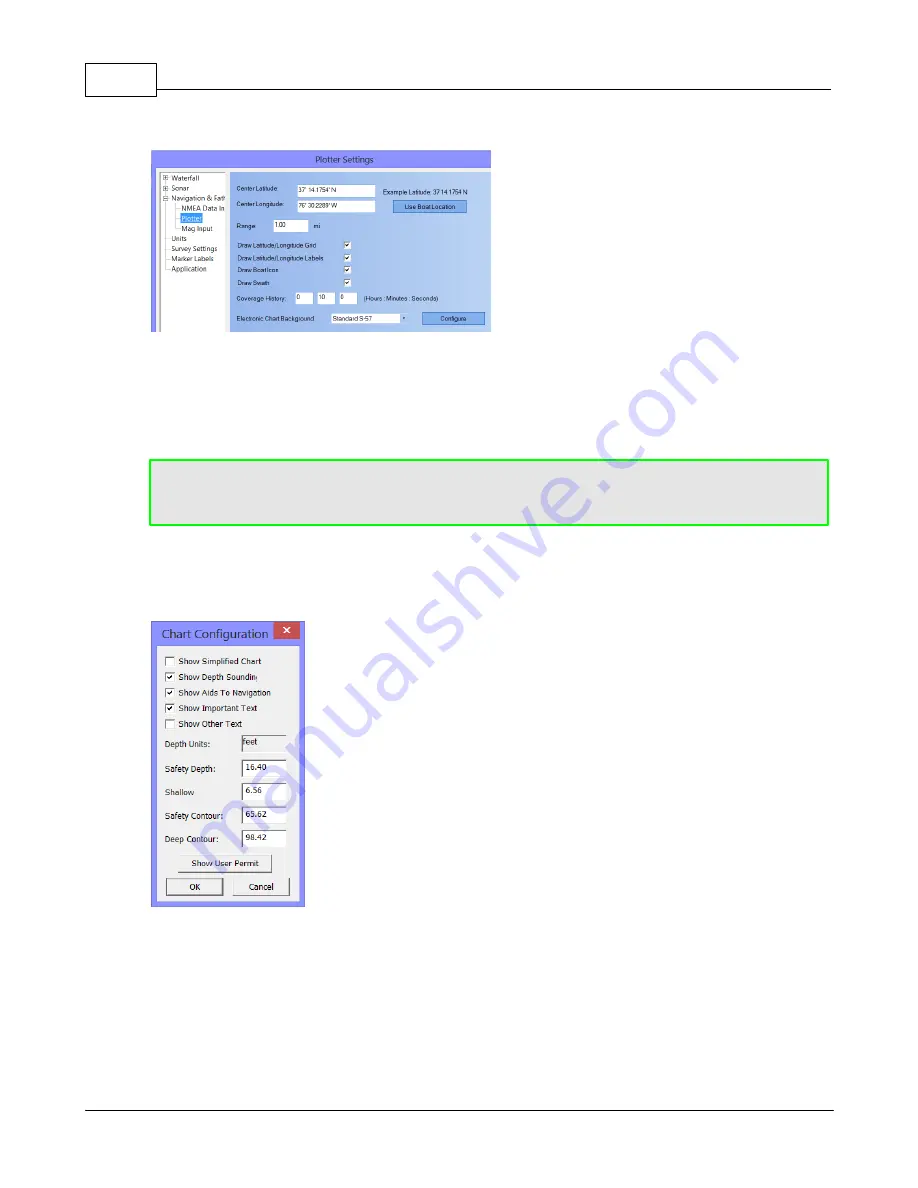
The Plotter Settings Window

The Plotter settings page lets the user make
changes that directly affect the Plotter
Window. 

Range:  

Lets the user adjust the range of the

plotter's segments.

Draw Latitude/Longitude Grid: 

 If checked,

will draw the latitude and longitude grid lines.

Draw Latitude/Longitude Labels:  

If checked,

will draw the latitude and longitude labels.

Draw Boat Icon:  

If checked, will draw the boat and towfish icons on the plotter.

Draw Swath:  

If checked, will draw the red and green swath lines on the plotter.

Coverage History:  

An edit box that allows the user to specify how far back in time to see the

coverage.  The time is in HH:MM:SS format.  The default coverage history time is 10 minutes. 

CAUTION:  

The longer the time that you set for coverage, the busier the Sea Scan

®

Survey software will be trying to maintain updates on the display, so keep the coverage
history small while scanning. 

Electronic Chart Background: 

 Turns the digital chart capability on or off.  If the charts are

available, the user can choose between Standard Electronic Charts (ENC) or Premium ENC Charts. 

Configure: 

 Opens another window which lets the user configure the charts for use. 

Chart Configuration

Window

Sea Scan

®

 Survey uses two separate charting folders:

1. USENC for the unlicensed/free S-57 charts
2. LSENC folder for the licensed/purchased S-57 ENC charts.

The details on chart management for each chart type are listed below. 

Unlicensed/Free (NOAA USA Coast Line) S-57 charts

To use the unlicensed/free S-57 charts in Sea Scan

®

 Survey, you must

install the <

Install Sea Scan Survey USA Charts.exe

> installation package.

 This will create a base chart  database, add the World Vector Shoreline
(WVS) data, and optionally install precompiled National Oceanic and
Atmospheric Administration (NOAA) USA coastline charts.  If you install the
NOAA USA coastline charts using the installer and do not need to update,
remove, or change the charts, then you do not have to do anything else.

To update or remove charts from the database, Sea Scan

®

 Survey uses the

USENC folder for your chart database. To select charts for use with Sea Scan

®

 Survey, visit NOAA’s

ENC chart downloader web site:  

http://www.charts.noaa.gov/ENCs/ENCs.shtml

.

Once there, choose the particular set of charts you would like to use. 

Summary of Contents for Sea Scan

Page 1: ...Sea Scan Survey Software Manual Marine Sonic Technology Ltd White Marsh VA V3 0 0 2013 Marine Sonic Technology Ltd ...

Page 2: ... www marinesonic com This manual and the hardware software described in it are copyrighted with all rights reserved Under the copyright laws neither this manual nor the hardware software may be copied in whole or in part without the written consent of Marine Sonic Technology Ltd except in the normal use of the software or to make backup copies This exception does not allow copies to be made for ot...

Page 3: ...op Wash 6 Shadows Section 3 Sea Scan Survey 8 8 1 Software Overview 8 2 Buttons and Menu 8 Waterfall Toolbar 9 Status Bar 10 Main Menu 10 File Menu 10 View Menu 10 Tools Menu 11 Help Menu 12 Windows 12 Navigation Plotter 12 Using the Plotter 14 Plotter Toolbar 14 SONAR Control 16 Status 16 Signal Statistics 17 A Mode 17 Image Adjustment 17 Using the Image Adjustment Window 17 Settings 18 Waterfall...

Page 4: ...figuring the Electronic Charts 27 Mag Input 28 Units 28 Survey Settings 28 Marker Labels 29 Application 29 Layback 30 Range Bearing 30 Understanding the Range Bearing Tool 32 Event 32 Layback 32 Using the Layback Events Window 33 Marker 33 Using the Marker Events Window Section 4 Revision History 33 Section 5 Glossary 34 ...

Page 5: ...ool set that allows range length height and area measurements all of which can be executed in real time or during post processing operations In addition to measurement tools Sea Scan Survey software provides an adjustable magnification zoom tool and a target marking tool Added features include an advanced target marking system for instant access to any real time marking point during either the on ...

Page 6: ...x 730 5508 George Washington Memorial Highway White Marsh VA 23183 0730 For technical support call 800 447 4804 or visit our website at http www marinesonic us International callers please use 804 693 9602 Customer Support at Marine Sonic Technology Ltd also welcomes your questions comments and corrections about this manual In any correspondence we would appreciate the publication number equipment...

Page 7: ...suring the time it takes for their echo to return after hitting the object 2 2 How Side Scan SONAR Works Because of their flexibility side scan systems can be used in many applications some of which involve highly sophisticated remotely operated vehicles ROVs or autonomous underwater vehicles AUVs But the most common side scan systems are towed behind a surface vessel and comprise three elements t...

Page 8: ...t line representing strong or weak echoes relative to time The stronger the SONAR s returning signal the brighter the mark that appears on the SONAR window The resulting accumulated lines then form a coherent picture of the seafloor The two transducers provide information unique to their particular side of the towfish The transducers return information about their side of the towfish In between th...

Page 9: ... from each ping returns and is drawn on the screen The quality of the SONAR data will depend on operator and the data gathering process which involves vessel course tow speed towfish altitude above the bottom sea conditions and range settings For example a higher range setting yields a larger data sample with more of the seafloor displayed but the data will not have as high a resolution 2 2 1 How ...

Page 10: ...ations In deeper water the sound beam will not reach the surface 2 2 1 3 Prop Wash Prop Wash shows in the waterfall when the churning waves and air bubbles produced by the ship s propellers are picked up in the transducer s beam The effects of prop wash This problem occurs mainly when the towfish is in shallow water In deeper water the transducer s beam should be out of the propeller s wash and th...

Page 11: ...oduce shadows In the image to the left the shadow area has nothing there to return a sound Thus a shadow is created Just as with a sun created shadow the height of an object determines the length of the shadow A SONAR shadow This shadow example is an image of a bridge pylon In this image you can see the large base as a rounded corner rectangle In the center is the pillar The shadow shows that the ...

Page 12: ...r Used to control the waterfall s SONAR data 6 Waterfall The workspace where the SONAR data is displayed 7 Status Bar Displays the current status of the Survey this data is the most important 3 2 Buttons and Menu 3 2 1 Waterfall Toolbar The Waterfall toolbar 1 Elapsed Time Indicator The running clock at the top of the waterfall displays the amount of elapsed time from the start of the file to the ...

Page 13: ...ure the height of shadows off an object First click the first bottom return then click the end of the object that caused the shadow then click the end of the shadow The measurement will be calculated and shown in the Measurement Readout 10 Marker Tool This tool allows the user to double click on the waterfall to create Marker Events 11 Palette Control This tool displays the current palette color t...

Page 14: ...gram 3 2 3 2 View Menu The View menu The View Menu lets the user close or open some of the Bars and Windows of the Sea Scan Survey program A check mark inside a gold box will appear next to a Bar or Window that is currently open Ones with no checks are not open 3 2 3 3 Tools Menu Settings Opens the Settings Window allowing for changes to be made to the Sea Scan Survey settings See also the section...

Page 15: ...lip of data Opens a save window allowing for the file to be named TIP The data inside the parenthesis represents a button that can be used as a hot key instead of the Tool Menu 3 2 3 4 Help Menu Sea Scan Survey Help Menu Help Opens the Sea Scan ARC Explorer Operations Manual as a Help File for the user About Sea Scan Survey Opens a window that displays Sea Scan Survey information as well as compan...

Page 16: ... show the estimated coverage The coverage for the left port channel is shown in red and the swash coverage for the right starboard channel is shown in green The boat s path is displayed with a black line The Plotter will not draw a swath when the SONAR is off or if that option has been deselected Some data is necessary for the Plotter to show a track that data may be simply a rub check or by havin...

Page 17: ...e Waypoints and Marker Events appear as dots on the Plotter window When selected they will be surrounded by a bulls eye Plotter points unselected left and selected right When a Waypoint or Marker is selected on the Plotter a small tool tip will pop up giving its details The Marker Events Window will contain a preview image waypoints will not A waypoint and its details on the Navigation Plotter ...

Page 18: ...f the boat The projected forward swath when the Map Bearing Line is engaged 4 Auto Center Select or deselect this to set the map to center or not center on the boat 5 Zoom In Click to zoom the Plotter in 5 6 Zoom Out Click to zoom the Potter out 5 7 Zoom to Selection Click to draw a box around a particular area of interest and zoom in on it Click to set the center of the Zoom Box then drag to chan...

Page 19: ...cked by most users Range Change the range of the SONAR here Click the arrows to the left or right or select the drop down arrow from inside the box to select a frequency of your choice Range Delay This setting removes the water column Range delay removes the acoustic returns for the amount of feet desired CAUTION If using this option to remove the water column the towfish no longer shows in the wa...

Page 20: ...the current Speed Over Ground S0G Shows the current Course Over Ground COG Shows the current heading Fathometer Shows the towfish s current Altitude in the water Shows the towfish s current Depth in the water Orientation Shows the SONAR s orientation Shows the SONAR Layback Shows the X Axis of the SONAR Shows the Y Axis of the SONAR Shows the amount of Cable that is out Magnetometer Shows the curr...

Page 21: ... can be adjusted separately for each channel The time varied gain TVG in the system is automatic unless you deselect that function in the Settings Window 3 2 4 6 1 Using the Image Adjustment Window Gain and Histogram adjustment at the Image Adjustment Window The Gain sliders on each side of the Image Adjustment Window go from 0 bottom at the lowest to 100 top at the highest The sliders let the use...

Page 22: ... permits the user to condense the data into a subsample if a sample size is larger than the pixel width of the displayable area That is the Waterfall Subsample will take either the Average of the samples or the Peak highest sample The default is the Peak sample and is used for the most detailed image Manual TVG allows the user to turn off the Time Variance Gain and to manually adjust the gain Clic...

Page 23: ...ata collected This option determines how many samples per channel are received CAUTION This change affects the raw data saved to the disk Lowering the resolution lowers the amount of data saved This change affects not only the screen but also the actual raw data that is saved to the disk Along Track This setting affects the ping rate and several aspects of SONAR data collection First it controls t...

Page 24: ... Lets the user connect the software to an ARC Explorer hardware configuration This interface has access to the Advanced Settings configuration 3 2 4 7 3 Navigation and Fathometer 3 2 4 7 3 1 NMEA Data Input The NMEA Settings Window The NMEA Data Input settings page lets the user select a GPS unit from a list of available units and to test the connections WARNING The program only supports the use o...

Page 25: ...s the user which communications port is open in addition it allows the user to remove that port or to test the currently selected unit to make sure it is getting good data Remove It will return to the available ports list if it is still available Test It will open up the Test Communications Window which displays the individual NMEA 0183 strings that Sea Scan Survey supports If NMEA data is showing...

Page 26: ...are available the user can choose between Standard Electronic Charts ENC or Premium ENC Charts Configure Opens another window which lets the user configure the charts for use Chart Configuration Window Sea Scan Survey uses two separate charting folders 1 USENC for the unlicensed free S 57 charts 2 LSENC folder for the licensed purchased S 57 ENC charts The details on chart management for each char...

Page 27: ...harts into the Sea Scan Survey charting database Start Sea Scan Survey and choose Chart Management from the Tools menu This will open the Cell Manager program The cell manager starts by asking the location of the chart database For the unlicensed free charts this location is typically C Program Files Marine Sonic Technology Ltd Sea Scan Survey USENC You can browse to the folder using the ellipse b...

Page 28: ...ts in Sea Scan Survey you must install the Install Sea Scan Survey Licensed Charts exe installation package This will create a base chart database add the World Vector Shoreline data and install USB drivers for the USB security dongle TIP When installing or using the licensed charts the USB security dongle must be plugged into the computer Sea Scan Survey uses the LSENC folder for your chart datab...

Page 29: ...eck with your chart distributor for details about the subscription service and updates To order the charts in your basket you typically send the Chart Basket file to the distributor by e mail along with the User Permit that is associated with your licensing dongle The User Permit is a 28 character code made of letters and numbers TIP You should have received a User Permit with the Sea Scan ARC Exp...

Page 30: ...xt button The last step before the installation process begins is to select the permit file This file should be a text file that the chart distributor sent you when you purchased the charts It is usually called permit txt Click the ellipse button to browse to the location where you stored the permit file When a valid permit file is chosen the application will indicate it by displaying the permit d...

Page 31: ... of the shore 3 2 4 7 3 3 Mag Input The Mag Input settings page lets the user add magnetometer data to the stream The Mag Input Settings Window The output will show on the Status Window of Sea Scan Survey Magnetometer status Mag Type Lets the user switch between different SONAR systems Proton4 SeaSPY 866 880 ASCII Port Number Lets the user select which port the magnetometer is connected to Baud Ra...

Page 32: ... of the survey files The Start date and time of the survey The name of the survey The survey file name s prefix A list of all the files in the survey Editable setting The user may edit the description of the survey This is a permanent change to the file that stores the description s information 3 2 4 7 6 Marker Labels The Marker Labels Window The Marker Labels Window allows the user to assign prio...

Page 33: ...m derived from the location of the GPS unit as 0 0 Bow Y Stern Y Port X Starboard X X Relates to the position of the left port or right starboard side of the boat Y Relates to the front bow or back stern of the boat in relation to the location of the GPS Unit Z Relates to the distance between the water and the cable s tow point Click on the Worksheet button to open a very easy way to input this in...

Page 34: ...oard is green The boat s bearing in the Range and Bearing Window Boat Range Bearing The Boat s Range and Bearing is the center circle The red line is the target The boat s range and bearing can be used to direct the boat directly over the target This can be useful in putting the boat right above a target so that divers etc can have easy access to the target This also includes the name of the waypo...

Page 35: ... the Range and Bearing Window Here the Marker is highlighted and showing in the waterfall about one third of the way to the edge of the right starboard side swath The marker location behind the boat on the Range and Bearing Window Here the boat s swath went over the target and the target is now behind the boat The arrow in the Range and Bearing window corresponds to the waterfall data The boat ico...

Page 36: ...4 10 Event 3 2 4 10 1 Layback The Layback Events page shows a list of all the Layback Events that have been created in the Survey 3 2 4 10 1 1 Using the Layback Events Window The Events Window Apply Edit Changes Select a Layback Event from the list The input fields will be filled out in relation to the selected Event A user may change the data in the event and then apply the edited changes Jump To...

Page 37: ...ype Displays the priority of the marker 4 Save Clip Lets the user save a 500 ping SONAR data clip SDS of the marker This is useful for sharing the data and is about 300 MB in size A window will open and let the user input a personalized name 5 Jump To Allows the user to move the waterfall to that selected Marker Event 6 Sort By Time Check this to sort the markers by time rather than by name 7 Dele...

Page 38: ... Underwater Vehicle axial layback The offset distance from the position of the towfish to the navigation antenna backscatter Reverberation caused generally by sea conditions bottom roughness and angle of incidence baud rate A unit for measuring data transmission speed where one unit equals 1 bit per second beam spreading The widening angle of a SONAR beam as it moves farther from the transmitter B...

Page 39: ...se or spreadsheet application decibel The unit of sound intensity used to describe the strength of transmitted and received underwater sound EULA End User License Agreement ETE Estimated Time EnRoute fathometer An acoustic device that measures the current water depth FAQ Frequently Asked Questions frequency The number of sound waves that pass any specific point in one second gain Amplification of ...

Page 40: ...ime meridian that stretches from the North Pole to the South Pole and passes through Greenwich England lossy medium The physical degradation of an acoustic signal as a result of such conditions as absorption by the water wave front spreading or scattering LUT Look Up Table magnetometer An external device that measures the current total magnetic field marker An item of interest the operator can tag...

Page 41: ...at transforms electrical signals into sound waves pulse length The length of time that a SONAR unit is transmitting one pulse pulse width The horizontal width of the SONAR signal from the transmitter RAM Random Access Memory range The maximum distance from the transducers that the SONAR signal can detect usable signals range delay The distance or range the Sea Scan software is told to delay after ...

Page 42: ...overage of the SONAR signal on each sweep of the seabed also called a line TCU Topside Communications Unit topside processor The control unit an operator uses on the towing vessel to collect and observe the incoming data from the transducers towfish The device that is towed through the water on which the transducers are mounted transducer The projector and hydrophone that make up an active SONAR s...

Page 43: ...sh relative to the water s depth or the presence of sea clutter waterfall A term used to describe a display that puts the newest data at the top and scrolls the data down like a waterfall wavelength The distance between acoustic waves waypoint A position of interest made and displayed on the navigation Plotter WVS World Vector Shoreline xvy The extension that the software attaches to the names of ...

Page 44: ...Sea Scan Survey Software Manual 40 2013 Marine Sonic Technology Ltd ...

Page 45: ...ilable Ports 20 B Baud Rate 20 27 black line 12 boat icon 16 Boat Range Bearing 30 boat range and bearing 30 boat s path 12 Both Transducer Channels 8 bulls eye 12 C Cable 16 Cable Out 29 Caption Bar 8 center circle 30 Chart Basket 22 chart catalog 22 Chart Management 10 22 check mark 10 circle 18 Clear Data 14 Close 10 coastline charts 22 COMmunications port 20 Configure 22 Continue Survey 10 Cou...

Page 46: ...meter 16 field replaceable transducers 1 File Menu 8 First Bottom Return 6 frequency 14 G Gain sliders 17 Get Depth From Waterfall 29 gold box 10 GPS data 12 GPS Status 9 green starboard 30 H HDS hardware 20 heading 1 height off the bottom 29 Height Tool 8 Help 11 HH MM SS 22 Home Button 8 horizontal axis 17 Horizontal Beam Width 5 HTML file 10 I icon 12 Image Adjustment Window 17 Install Exchange...

Page 47: ...non solid return 6 Not a zip archive containing an Exchange Set 22 Not an exchange set 22 O Open 10 Open Ports 20 Orientation 16 P Palette Control 8 Path to the compressed Exchange Set 22 Path to the root folder of the Exchange Set 22 Pause on Error 22 permit txt 22 Ping Capture 10 ping rate 1 pixels 18 Plotter settings 22 Plotter settings page 22 Plotter Settings window 12 polymer attachments 1 P...

Page 48: ...2 Start a New File 10 Start Stop Button 20 Status Bar 8 Status Window 1 16 27 Stop Button 8 Surface Return 6 surface vessel 12 Survey 16 Survey Report 10 Survey to XTF 10 swash coverage 12 swath coverage 1 Swath distance 30 Swath Range and Bearing 30 T target marking system 1 Test 20 27 Test Communications Window 20 Time 17 Time Variance Gain 18 time varied gain 17 Tool Definitions 8 tool tip 12 t...

Page 49: ... 9 Waterfall Toolbar 8 Waypoint 14 winch 29 Worksheet 29 Worksheet button 29 World Vector Shoreline 22 World Vector Shoreline data 22 X X 29 X Axis 16 XTF 10 XTF format 10 Y Y 29 Y Axis 16 Z Z 29 Zoom Box 14 Zoom In 14 Zoom Out 14 Zoom to Selection 14 Zoom tool 8 18 ...

Reviews: