Operating Instructions
32
Tympanometry Printout
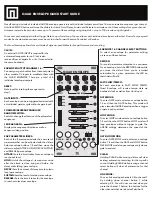
To the left is a sample tympanometry printout from the thermal
paper printer.
The header shows the protocol name in the first line followed
by the date/time of the test, test number, instrument serial
number, probe serial number, and firmware version.
Patient number is indicated or a blank line is provided to write in
the name. (See section 8.7 for information on using numbered
patients).
The ear (Right or Left) and the test result (Pass or Refer) will be
indicated on the printout.
Data table:
Frequency = probe tone frequency (226 or 1,000 Hz)
Ear volume = indicates the volume of the external ear canal
Gradient = indicates graph width in daPa value (tympanometric
width at 50% of the peak)
Compliance = displays the peak compliance
Peak Pressure = displays the pressure corresponding to peak
compliance
Graph:
Vertical = relative canal volume (ml) indicated by the arrow and
dynamic compliance indicated by the peak of the curve (ml)
Horizontal = pressure corresponding to peak compliance (daPa)
If the tympanogram is within the preset limits, the peak will be
within the box displayed on the screen and the test result will be
Pass
.
Figure 49
Summary of Contents for Ero Scan Pro
Page 74: ...1162 0802 Rev E 05 12...


