Page 45
©
2013 Magnum Energy, Inc
.
Appendix A – Specifi cations
70%
75%
80%
85%
90%
95%
200
700
1200
1700
2200
2700
3200
3700
4200
Inverter Power (Wattage)
E
ff
ic
ien
cy
(P
er
ce
n
tag
e)
A-2 Performance
Graphs
A-2.1 Inverter
Effi ciency Curve
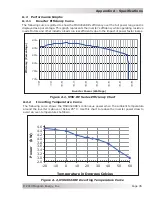
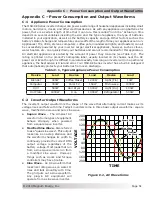
The following curve is plotted to show the MSH4024RE’s ef
fi
ciency over the full power range and is
displayed as a percentage. This graph represents the inverter’s ef
fi
ciency while operating resistive
loads. Motors and other inductive loads run less ef
fi
ciently due to the impact of power factor losses.
Figure A-1, MSH-RE Series Effi ciency Chart
2.8
3.0
3.2
3.4
3.6
3.8
4.0
4.2
4.4
4.6
-20
-10
0
10
20
30
40
50
60
Temperature in Degrees Celcius
Po
we
r (kW
)
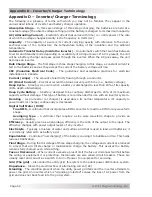
Figure A-2, MSH4024RE Inverting Temperature Curve
A-2.2
Inverting Temperature Curve
The following curve shows the MSH4024RE’s continuous power when the ambient temperature
around the inverter is above or below 25° C. Use this chart to reduce the inverter power draw to
avoid an over-temperature shutdown.

