background image

LogicStudio


17


918291


RevA

The


display


automatically


updates


to


reflect


the


current


conditions


whenever


display


adjustments


or


a


new


acquisition


is


obtained.


The


blue


horizontal


bar


represents


the


digital


samples


acquired.


The


labels


on


each


end


of


the


bar


show


the


time


extent


of


that


data


relative


to


the


trigger


point.


The


red


horizontal


bar


represents


analog


samples


(if


present)


acquired


from


an


attached


oscilloscope


and


the


labels


on


each


end


of


the


bar


show


the


time


extent


of


that


data


relative


to


the


trigger


point.


The


trigger


point


itself


is


denoted


by


the


solid


vertical


green


bar


(

A

).


The


current


pre/post

store


setting


for


the


digital


device


is


denoted


by


the


dashed


green


rectangle


(

B

).


These


two


indicators


align


when


a


new


acquisition


is


obtained;


however,


the


pre/post

store


control


can


be


adjusted


by


the


user


to


change


the


setting


for


subsequent


acquisitions.


The


pre

store


amount


(as


a


percentage


of


the


total


digital


acquisition)


is


always


displayed


next


to


this


rectangle.


The


yellow


translucent


viewbox


represents


your


current


view


in


the


waveforms


display.


This


shaded


region


also


provides


information


for


relative


zoom


level


and


position


within


the


acquired


data.


WorldView


control


uses


include


the


following:


Left

click


and


drag


the


yellow,


translucent


viewbox


to


pan


the


waveform


display


(to


the


left


or


right)


through


the


acquired


data.


Increase/decrease


the


current


timeframe


by


left

clicking


and


dragging


the


left


or


right


edges


of


the


viewbox.


This


adjusts


or


stretches


the


left


or


right

most


visible


time


point


on


the


display


while


leaving


the


other


side


pinned.


Replace


the


existing


viewbox


with


a


new


one


by


left

clicking


outside


the


existing


one


and


dragging


to


the


desired


timeframe


size.


Center


your


existing


viewbox


by


right

clicking


outside


the


existing


one.


This


centers


the


viewbox


around


the


point


in


time.


Change


the


pre/post

store


setting


for


the


digital


device


by


left

clicking


and


dragging


the


pre/post

store


control


(B).


The


ratio


displayed


as


a


percentage


next


to


the


indicator.


Auto

adjust


the


view


to


exactly


fit


the


complete


timeframe


of


any


digital


and


analog


data


currently


displayed


by


clicking


the


button


directly


to


the


left


of


the


WorldView


display.


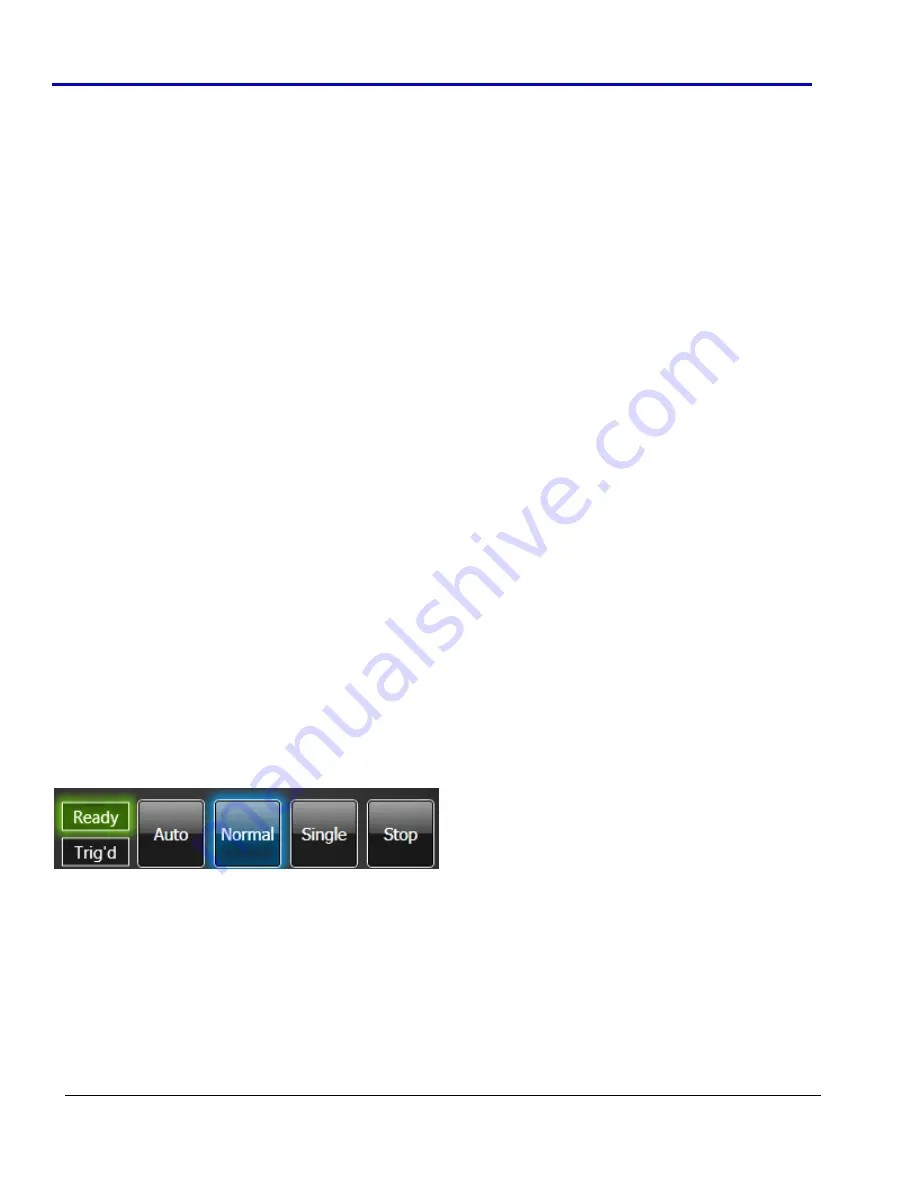
Run Modes 

Four


run


mode


buttons


are


available


on


the


upper

right


of


the


dashboard


as


follows:


The


modes


Auto

,


Normal

,


Single

,


and


Stop


behave


similarly


to


an


oscilloscope.


Stop


prevents


any


new


acquisitions.


Single


mode


attempts


to


get


exactly


one


new


acquisition,


while


Normal


gets


repeated


acquisitions.


Auto


mode


is


similar


to


normal


except


it


times


out


and


forces


a


trigger


if


the


current


trigger


condition


hasn’t


been


met


within


a


specified


period


of


time.


The


Run


Mode


section


of


the


dashboard


also


contains


two


green


indicators


for


Ready


and


Triggered

.


These


indicators


reflect


the


state


of


the


digital


device


at


any


point


in


time.


Summary of Contents for LogicStudio

Page 1: ...LogicStudio Getting Started Manual April 2010 ...

Page 2: ... or c for any damage or malfunction caused by the use of non LeCroy supplies Furthermore LeCroy shall not be obligated to service a product that has been modified or integrated where the modification or integration increases the task duration or difficulty of servicing the instrument Spare and replacement parts and repairs all have a 90 day warranty The instrument firmware has been thoroughly test...

Page 3: ...play 18 Signals Control Panel 18 Arranging Your Signals 19 The Context Menu 19 Modifying a Signal 20 The Data Table 21 The Dashboard 22 Device Connections 22 Pin Activity 22 Setup 22 Signals List 23 Instrument 24 Trigger 24 The Menu Bar 26 Save Load Setup Acquisition or Screenshot 26 Save Load Setup 26 Default Setup 26 Save Load Acquisition 26 Save Screenshot 26 Devices 26 Device Connections 26 Si...

Page 4: ...slight difference between screenshots seen in this manual running on Windows Vista and the interfaces you ll find from the software and operating system versions you re running Different versions of the application and or running the application under different operating systems may result in slight interface appearance differences Regardless the differences do not prevent you from easily followin...

Page 5: ...e equipment it is connected to in a manner other than specified may impair the protection mechanisms Connect and disconnect properly Avoid damage to cables thru excessive bending Do not use in wet damp or explosive atmospheres Do not operate with suspected failures Do not use this accessory if any part is damaged All maintenance should be referred to qualified service personnel Keep product surfac...

Page 6: ...contents Two files and two folders should be shown Double click the file named Setup exe to launch the installer The installer guides you through proper setup of both the LogicStudio software and necessary drivers for your computer as explained in the following topics Software Installation The LogicStudio Setup Wizard is then shown Click Next to proceed with the installation Note Included in this ...

Page 7: ...cting I Agree and then click the Next button to continue You can leave the default Installation Folder path or specify a new location Also determine whether or not to install the software for yourself or anyone who uses the computer After making the desired settings click Next to proceed ...

Page 8: ...you that the LogicStudio installer contains signed and unsigned drivers Windows prompts you to this affect by showing driver confirmation dialogs Note Keep in mind that installation interface screens differ slightly between Windows operating systems Regardless of appearance choose the option to Install or Continue Anyway when prompted about LogicStudio drivers ...

Page 9: ... Continue button to proceed Note The previous screen differs slightly between Windows operating systems Again regardless of appearance choose the option to Continue when prompted The progress of the LogicStudio installation is then shown ...

Page 10: ...e computer once the installation has finished Note Depending on your operating system Windows shows additional driver interfaces when LogicStudio is actually plugged into your computer Always choose the Install the software automatically option and click the Next button to complete the driver installation ...

Page 11: ...tudio 11 918291 RevA The Installation Complete screen is shown Click the Close button to complete the installation Now with correct application software and drivers installed your LogicStudio is ready for use ...

Page 12: ...and drag left right When the mouse button is released your zoom is shown in the waveform display area Scale the Timeframe Click and Drag Right click and drag left right to scale the timeframe and view zoom in out around the center point of the view OR Scale the Timeframe Mousewheel You can alternatively scale the timeframe using the mousewheel by putting your mouse pointer anywhere inside the wave...

Page 13: ...ursors Tool This topic demonstrates the use of the Cursors tool When the Cursor tool is enabled you are currently armed with the selected cursor pair on the waveform display When expanded the tool s detailed control provides storage for up to 4 cursor pairs When cursors are placed on the display they are highlighted when the pair is selected from the numbered cursor pair Remove a pair by clicking ...

Page 14: ...lick and drag a cursor to a new location The display values are updated accordingly Clicking a created cursor in the waveform display automatically selects the cursor pair and enables the cursor tool When placing or moving a cursor over any digital signal the software looks for any nearby edges on the signal and snaps the cursor to that edge This allows for easier precise measurements between edge...

Page 15: ...hing your specified depth at which point the oldest acquisition is discarded when a new one is received Note The RearView tool is always enabled The default acquisition depth is set to 20 records The specific acquisition being viewed is always shown above the slider control for example in the previous screenshot the tool is showing acquisition 11 of 20 possible acquisitions When you acquire a new ...

Page 16: ... With the magnifier tool enabled you can still adjust the timeframe of the main waveform display by holding the Control key down while scrolling the mousewheel or dragging with the left and right mouse buttons as normal Tip This tool conveniently provides a quick magnified view of closely aligned edges or visibility of decode and bus value text WorldView The WorldView is an extremely powerful cont...

Page 17: ...e left or right through the acquired data Increase decrease the current timeframe by left clicking and dragging the left or right edges of the viewbox This adjusts or stretches the left or right most visible time point on the display while leaving the other side pinned Replace the existing viewbox with a new one by left clicking outside the existing one and dragging to the desired timeframe size C...

Page 18: ... status display appears in the upper right corner of the dashboard above the Persistence and Clear controls This display provides messages when certain device actions are taking a longer period of time For example the Status Display indicates when the software is waiting for a trigger to occur accumulating a large pre post store or downloading data from an oscilloscope Signals Control Panel The si...

Page 19: ...display area by clicking and dragging the bottom edge of a signal to increase decrease its height Add a new signal to the list by pressing the Add New Signal button With a signals selected in the waveform display area click the Delete Selected Signal button to remove the signal and its configuration Delete signals one at a time The Context Menu Right click on the signal control side of a desired s...

Page 20: ...formation instead of superimposing the signals Channels 1 and 2 in Stacked Mode Channel 2 superimposed over Channel 1 using Freeform Mode Modifying a Signal Click a signal s colored name box and corresponding details for the signal are shown on a dialog at the bottom of the waveform display area This dialog shows contents based on the selected signal s type It s also the same dialog used for indiv...

Page 21: ...you can scroll through the data use the Radix drop down field to change the data values provided the chosen signal supports your selection The data can also be Exported to a CSV file Clicking or using the up down arrow keys to select a row on the table centers the waveform display timeframe on the selected sample and highlights the transition with a vertical bar glowing in the color of the given s...

Page 22: ... X over the button indicates the device is not currently present or has been explicitly disconnected by the user You cannot make new acquisitions without a connection to a digital pod However you do not need to have an oscilloscope connected to create acquisitions PLEASE NOTE THE FOLLOWING Manually disabling or disconnecting the oscilloscope can speed up the rate of acquisitions if you temporarily...

Page 23: ...fy the signal Type Name Color and Source Channel s along with additional options depending on the signal Type selected Supported signal Types include Digital Line Digital Bus Digital Wave Analog Channel and I2C SPI UART Decodes Buttons at the top of the Signals list window allow you to add delete and reorder the list Note Making any modifications to the Signals List or the Signal Setup in any way ...

Page 24: ...at the trigger logic always runs at a rate of 500 MHz under all modes regardless of the selected Sample Rate This allows you to continue triggering on fast events even when lowering the Sample Rate to obtain a longer timeframe of data However this may result in trigger events that cannot be seen in the slower sampled acquisition data when presented on the waveform display area SIMPLE LOGIC TAB Use...

Page 25: ... EXTERNAL TAB Use this tab to set the logic pod to trigger on an external input signal A threshold voltage for the signal can be specified Sample Rate The Sample Rate spinner control is located at the top of the dashboard just to the right of the Setup buttons It shows the selected rate of sampling for the digital pod Use the up down arrow buttons at the right of the control to cycle through the h...

Page 26: ...cStudio for further examination or sent to another LogicStudio user along with your Setup configuration for additional analysis Data loaded into LogicStudio can be manipulated and displayed exactly the same as when it s acquired live Note All raw samples are saved This means you can reconfigure your signals after reloading an acquisition file to view different channel in new ways Save Screenshot L...

Page 27: ...hift the analog trigger point later in time and make the analog data move earlier in time relative to the digital data on the Waveform Display Area Negative value behaves inversely Help Help information is accessed under Help on the menu bar Access the User Manual to conveniently retrieve this same documentation or click About LogicStudio for the software version and LeCroy contact information Tel...

Page 28: ...Getting Started Manual 918291 RevA 28 Reference China RoHS Compliance ...

Page 29: ...t is below the limit requirement specified in SJ T11363 2006 X Indicates that this toxic or hazardous substance contained in at least one of the homogenous materials used for this part is above the limit requirement specified in SJ T11363 2006 EFUP Environmental Friendly Use Period Use Conditions Refer to the environmental conditions stated in the specifications section of the Getting Started Manu...

Page 30: ...tage Directive 2004 108 EC EMC Directive and that conformity with Council Directive 2006 95 EC is based on EN IEC 61010 1 2001 Safety requirements for electrical equipment for measurement control and laboratory use and that conformity with Council Directive 2004 108 EC is based on EN IEC 61326 1 2006 EMC requirements for electrical equipment for measurement control and laboratory use By David C Gr...

Reviews: