


Section 5: Measuring low-resistance devices
Model 2460 Interactive SourceMeter® Instrument User's Manual
5-6
2460-900-01 Rev. A / September 2014
View the measurements on the front-panel TREND swipe screen
You can view the resistance measurements as a function of time on the front-panel TREND swipe
screen. To access the TREND swipe screen, swipe the bottom part of the Home screen to the right. A
graph similar to the one in the figure below is displayed.
Figure 22: Model 2460 TREND swipe screen
To see the graph on the full screen, swipe up on the TREND swipe screen to open the Graph screen.
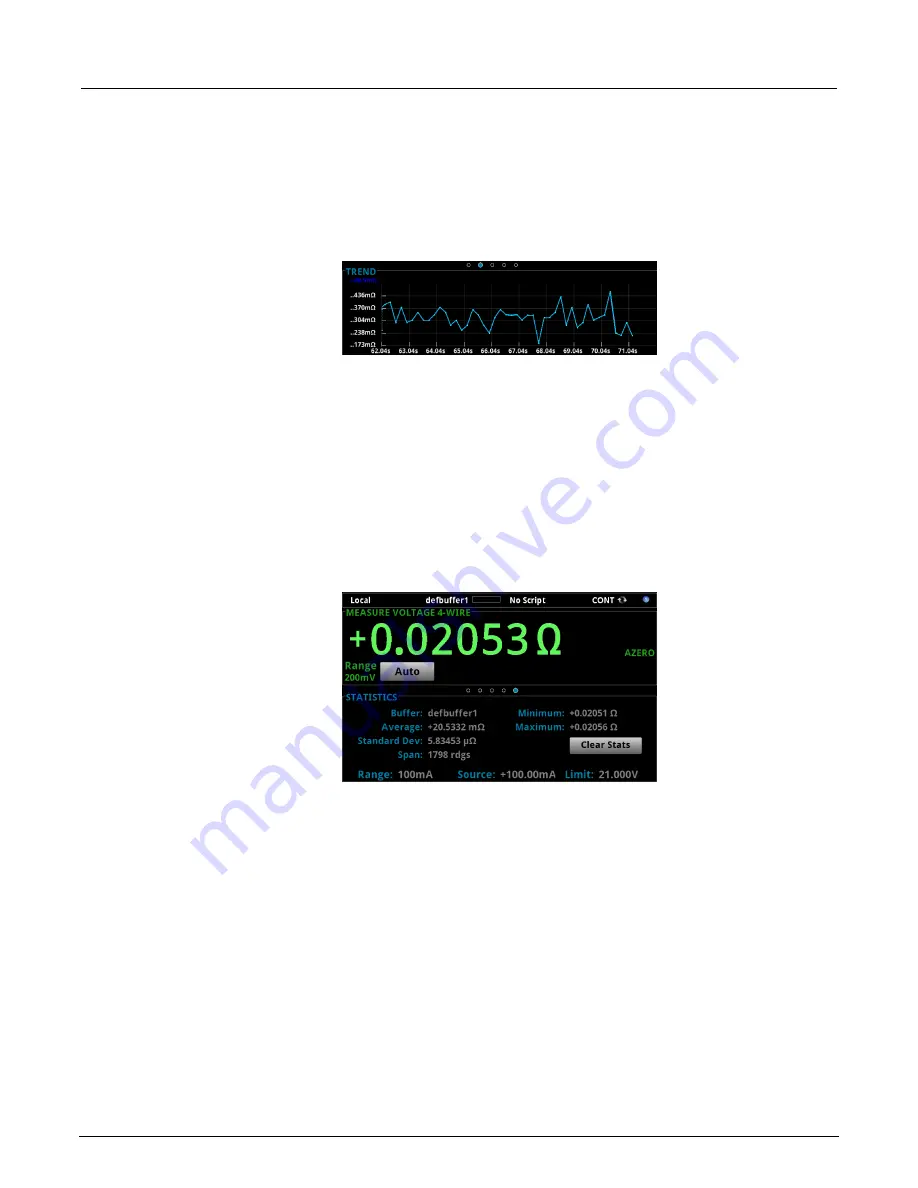
View the buffer statistics on the front panel
You can view the measurement statistics on the Model 2460 front-panel STATISTICS swipe screen,
including:
•
Buffer name
•
Minimum, maximum, and average reading values
•
Standard deviation
Figure 23: Model 2460 STATISTICS swipe screen
Set up the low-resistance application using SCPI commands
The following sequence of SCPI commands makes 100 low-resistance measurements by sourcing
current and measuring resistance. In this example, the source current magnitude and limit voltage are
set automatically. It uses remote commands to change the front-panel display to display the TREND
swipe screen. This allows you to view numeric data at the top of the screen and graphic data at the
bottom of the screen.