W W W . K A A R T A . C O M
2 8
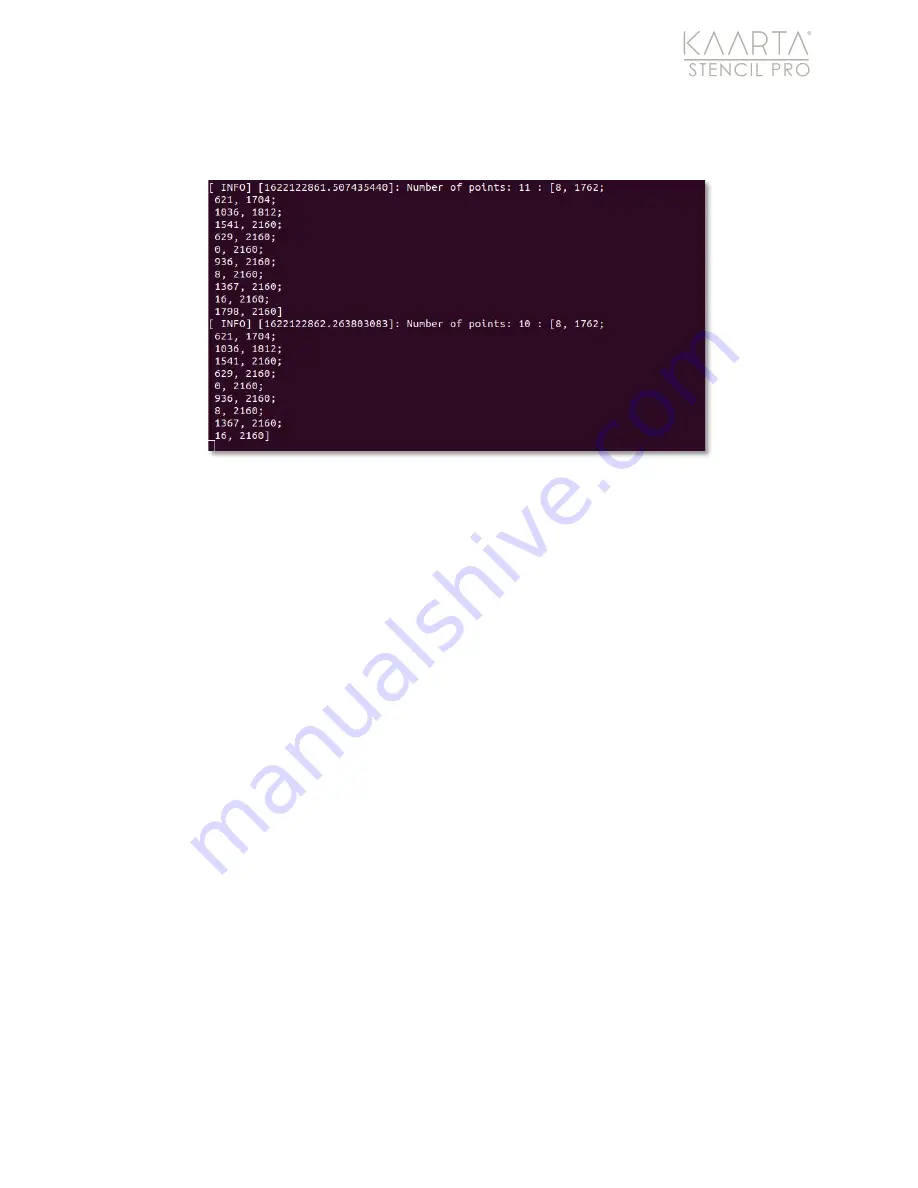
Once the areas to remove are highlighted, click “
s
” to see the points of the exclusion zones
listed in the terminal window. 0,0 is the upper left of the image (Figure 31).
Figure 31: Exclusion polygon.
This is also written to the active ROS environment so after this is done the color process
can be run and it will apply the exclusion zones. It will be useful to record this information
with the scan if you want to use it again. If the environment is cleared, the exclusion zone
will need to be set again. This can be done manually with the generated setting above or
the tool can be used again.


