IPU 40060 Issue 9
Page 18 of 27
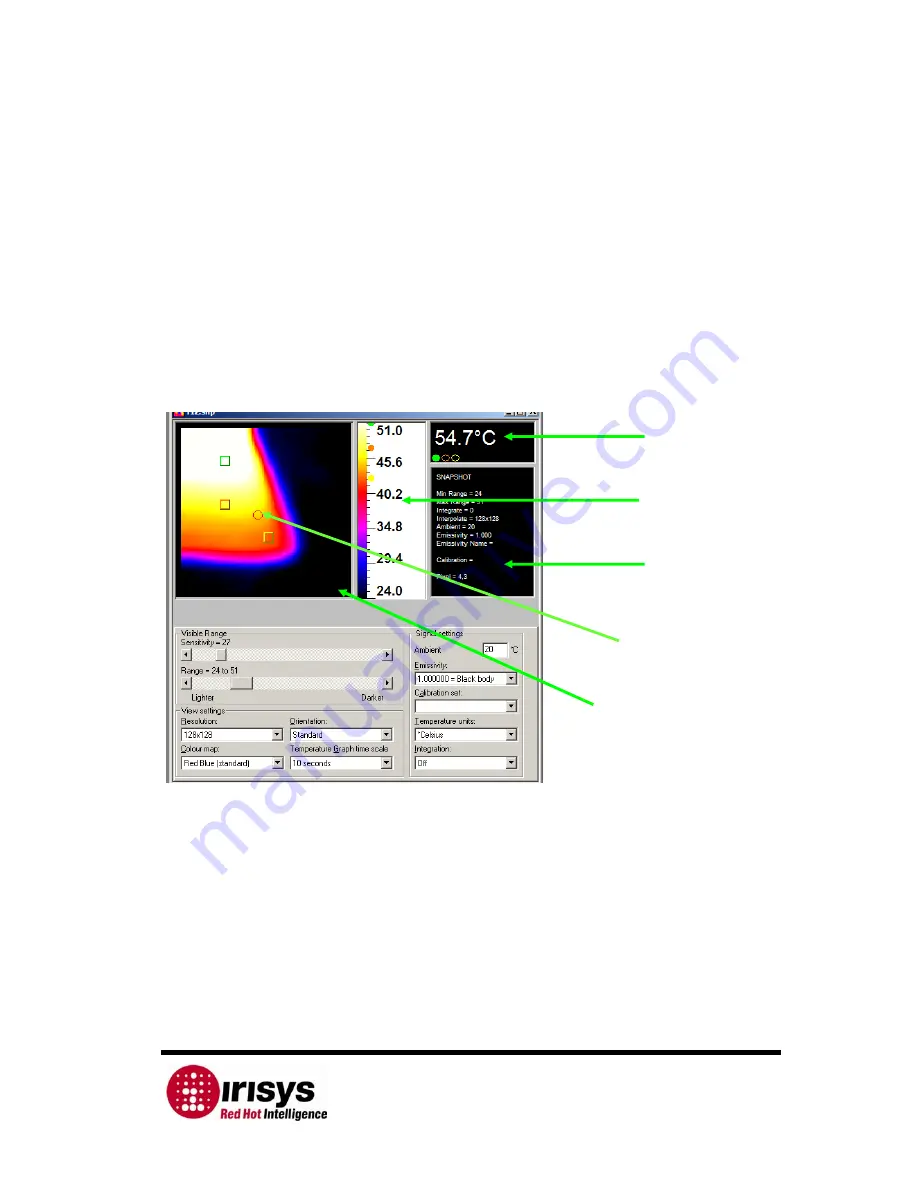
Laser Default Pixel
Image Window
2.5.2.2
Control Panel
The Controls in the control panel are as follows:
•
Sensitivity – see below for explanation.
•
Range – see below for explanation.
•
Resolution – sets the level of interpolation from 16 X 16 up to 128 X 128.
•
Colour map – sets the display in greyscale, red-blue or blue-green.
•
Orientation – the image can be rotated around to different orientations.
•
Temperature Graph time scale – sets the temperature graph range.
•
Ambient – set the ambient temperature.
•
Emissivity – select a value to suit the object under examination, see Note 3
in Section
3.1
.
•
Calibration Set – The calibration file is displayed in this box.
•
Temperature units – choose
o
Celsius,
o
Fahrenheit or Kelvin.
•
Integration – sets the number of frames to integrate, up to ten maximum.
Figure 12: Thermal Imager launch window
Adjusting the displayed Thermal Image:
•
The sensitivity and range can be automatically adjusted for a single image by
clicking on the ‘Single Auto Gain’ button. For continuous automatic adjustment
the ‘Continuous Auto Gain’ button should be selected, this button is on the tool
bar, see
Figure 13
.
•
To use the manual controls whilst imaging live, it is necessary to first toggle off
the ‘Continuous Auto Gain’ button. The horizontal scroll bars can be used to
manually adjust the displayed image’s sensitivity and range.
•
The ‘Sensitivity’ number indicates how many degrees span the image from
black (cold) to white (hot). The range numbers represent the upper and lower
values of temperature from black (cold) to white (hot).
Temperature
Display
Window
Selected
Temperature
Range
Status Box


