81
Using AptusNX
Spectrum Graph
1
2
3
No.
Item
Description
1
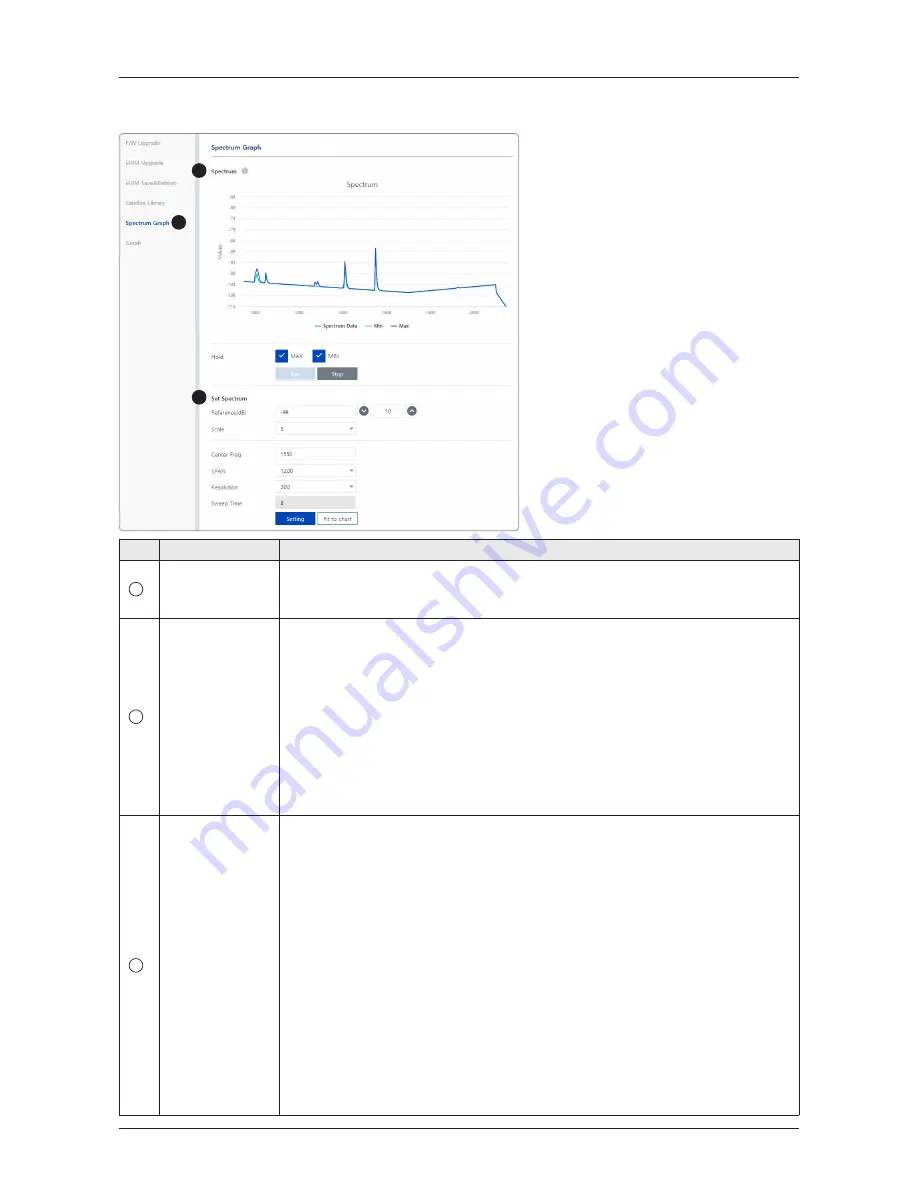
Spectrum Graph
Displays that a spectrum analyzer measures an input Rx signal frequency within
the full frequency range and sets spectrum data view options. The disconnect
fault can be checked and solved through spectrum analyzer results.
2
Spectrum Graph
Displays measurement results. The display of a spectrum analyzer has the
frequency on the horizontal axis and the amplitude displayed on the vertical axis.
• Hold: displays the minimum/maximum value of the frequency band on the
graph.
- Max: displays the maximum value of the frequency band by clicking the
check button.
- Min: displays the minimum value of the frequency band by clicking the check
button.
• Run: requests the spectrum data to antenna continuously and update graph
data in real-time.
• Stop: Stops requesting the spectrum data. (The graph cannot be updated.)
3
Set Spectrum
Sets detailed options for the spectrum graph.
• Reference/Scale: sets Amplitude Reference Level and Scale. Click the
Reference Level submenu key and use the arrow keys, or the keypad to change
the reference level (2000 to -2000). Select the Scale number (1, 2, 5, or 10 dB)
in the drop-down list to enter the desired scale.
• Center Freq.: enters the desired center frequency using the keypad.
• Span: to quickly move the span value up or down, select the span number (6,
60, 300, or 1200 MHz) in the drop-down list. These numbers facilitate a zoom-
in, zoom-out feature.
• Resolution: to quickly adjust the resolution value up or down, select the
resolution number (100, 200, 300, or 600) in the drop-down list. These numbers
facilitate a zoom-in, zoom-out feature.
• Sweep Time: displays the elapsed time all data received during the start to sop
testing interval.
Click the "Setting" button to apply the settings to the graph. Clicking the "Fit to
chart" button, the reference and scale value are automatically adjusted to easily
check the resulting graph.


