background image

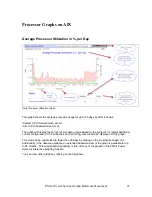
Guidelines for Total Processor Utilization


These are shown in the ‘FACTS’ at the bottom of most graph pages.  
 
These are the processor utilization guidelines that are used to determine if a resource is ‘OK’, 
‘marginal’, or ‘critical’. They are based on the number of processors that are configured for the 
server/LPAR. 


‘Average’ by definition indicates the average utilization for all hours in the shift for the measured 
days in the period.  
 
‘Peak’ average indicates an average of the two busiest hours during the shift for the measured 
days in the period.   
 
If a measurement exceeds the marginal percentage in the table, then the particular resource 
being measured should be given attention in the near future.  
 
If a measurement exceeds the critical percentage, then immediate attention should be given to 
the system resource being measured. 


22 

PM for Power Systems Graph Reference Document 


Summary of Contents for PERFORMANCE MANAGEMENT FOR POWER SYSTEMS - GRAPH REFERENCE DOCUMENT...

Page 1: ...ce Document A Guide to Help Understand The PM for Power Systems Offering and Process The PM for Power Systems Reports October 2010 Note Updates to this document are made periodically For the most curr...

Page 2: ...9 Report Calculation Principles and Definitions 10 The Difference Between Average and Peak Average 10 The Manner in which Trends are Calculated 10 Other Definitions 11 Terms and Conditions 12 What am...

Page 3: ...39 Management Summary Graphs MSG 40 Processor MSG 40 Disk Space MSG 41 File System MSG 42 Section 3 IBM i Interactive Graphs 43 Processor Graphs on IBM i 44 Guidelines for Processor Utilization 45 Ave...

Page 4: ...81 Average Response Time by the Hour 82 PC Response Time Graphs 83 Average Response Time per Measured Day PCs 84 Average Response Time per Hour PCs 85 Facts Charts 86 Response Time 87 Response Time Av...

Page 5: ...ve a single server with one logical partition LPAR or multiple servers with multiple LPARs PM for Power Systems can save you time These tools allow you to be proactive in monitoring your system perfor...

Page 6: ...Identify performance bottlenecks before they affect your performance Identify resource intensive applications Maximize the return on your current and future hardware investments Plan and manage consis...

Page 7: ...s updated daily from the previous collection if you transmit daily It is updated weekly if you transmit weekly The automated collection mechanism relieves the system administrator of the time consumin...

Page 8: ...r for a variety of reasons To help make it easy for the user to monitor whether transmissions are getting through to IBM on a consistent basis an icon on the Server Information Panel portrays a 90 day...

Page 9: ...and AIX If your system is logically partitioned LPAR we recommend that you enable PM Agent on all partitions Releases that are supported include those that have not reached End of Program Support dat...

Page 10: ...e prompted to generate WLE data and begin the upgrade sizing process When you access the WLE the advanced growth options allow you to adjust growth rates thresholds and time periods The output include...

Page 11: ...ting the respective boxes Select the servers to transfer to WLE then click Submit Servers for Sizing Your PM for Power Systems data for these partitions is automatically loaded into the Workload Estim...

Page 12: ...requirements You may also merge the previously collected PM historical data with the IBM Systems Workload Estimator to size needed upgrades etc Flexibility is also provided to arrange the information...

Page 13: ...d Software Supported PM for Power Systems is supported on all versions and releases of IBM AIX and IBM i that have not reached the End of Program Support date The End of Program Support dates can be f...

Page 14: ...k utilization based on the previous three and six months of historical data for this reason in addition to twelve months This allows you to more easily see rapid changes in utilization over a short pe...

Page 15: ...partition allocation System and Interactive on IBM i This is a comparison of Interactive plus OS utilization versus total processing capacity for the server or partition Total Utilization on IBM i Th...

Page 16: ...data with various third parties including one or more solution providers and Business Partners to make them aware of your performance and capacity demands and to enable them to provide you with a hig...

Page 17: ...key for the respective partition It is the user s responsibility to log into the PM for Power Systems graph site at https pmeserver rochester ibm com PMServerInfo loginPage jsp and register the parti...

Page 18: ...itions systems using PM for Power Systems that are assigned to the respective group As explained elsewhere in this document the icons and tabs initiate different functions like accessing the reports s...

Page 19: ...and Vertical Scrolling within the SIP The SIP has its own set of scroll bars providing an enhanced experience when accessing the data The horizontal scroll bar allows columns to be scrolled in and ou...

Page 20: ...r both first and second shift At the left of the screen are icons for using the Interactive graphing function or for requesting a pdf of either the entitled full service detail report set or the summa...

Page 21: ...be able to provide this CEID to the end user on their behalf Remember the SIP is available only after the system or partition has been transmitting PM data and the partition system has been registered...

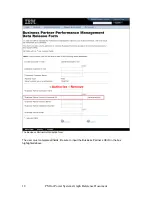
Page 22: ...The Business Partner Authorization form The user must complete all fields Be sure to input the Business Partner s CEID in the box highlighted above 18 PM for Power Systems Graph Reference Document...

Page 23: ...facets of the offering http www 03 ibm com systems power support perfmgmt For questions on the offering description For questions on the terms and conditions For questions on setting up PM for Power S...

Page 24: ...l function fee access to PM each graph category tab can be clicked on to select the type of graph to work with If the server or partition is only entitled for summary service the MSG tab will be the o...

Page 25: ...artitions current configuration If the model has an rPerf rating that will also be displayed on the graph This view can be customized to fewer than 90 days by clicking on the Customize Graph link Addi...

Page 26: ...ates the average utilization for all hours in the shift for the measured days in the period Peak average indicates an average of the two busiest hours during the shift for the measured days in the per...

Page 27: ...If there is a published rPerf rating for this model the graph will display the utilization measured in rPerfs as well as a percentage of total capacity The crosshatch area green indicates system jobs...

Page 28: ...h green in the bottom of the graph shows the CPU utilization that is acceptable The crosshatch yellow in the middle of the graph shows the CPU utilization that is marginal The backward slash red at th...

Page 29: ...plotting rPerfs when available is that rPerfs are a normalized unit of work independent of the resources allocated to the server LPAR This means that the black diamonds on the graph represent the wor...

Page 30: ...umber of processors is 5 For partial processor LPARs less than one processor 5 is the value used for the number of processors The recommended threshold for RunQ Over the Limit is 20 If the RunQ Over t...

Page 31: ...ts the percentage of time the run queue i e number of jobs waiting is greater than 5 times the number of processors in the partition The minimum value for the number of processors is 5 For partial pro...

Page 32: ...is 5 and the scan per second is 200 then a red flag indicator is shown which indicates additional memory or system tuning may be needed If the ratio is 5 or the scan per second 200 then a yellow flag...

Page 33: ...e target guideline for scan rate is 200 per second The target Average Scanned Freed ratio is 5 If the ratio is 5 and the scan per second is 200 then a red flag indicator is shown which indicates addit...

Page 34: ...or disk types The information under the Facts heading at the bottom of the graph states the recommended guidelines for marginal and critical peak utilization and the months calculated to reach this g...

Page 35: ...eriod The information under the Facts heading at the bottom of the graph states the recommended guidelines for marginal and critical peak utilization Note for systems with SAN based storage Each serve...

Page 36: ...months shown at the right of the graph Because each displayed value is an average the actual values during each month can be higher or lower than what is indicated on the graph Note for systems with S...

Page 37: ...a combined percentage capacity used for all disks assigned to the partition File System usage red Note that this metric can exceed 100 The file system measurement is a combined capacity for all file...

Page 38: ...range up to twelve months The height of the columns reflects the total internal and external disk assigned to the partition It also displays the projected usage for the following three months based on...

Page 39: ...ecified range up to twelve months It also displays the projected usage for the following three months based on usage trends over the last 3 6 and 12 months The graph depicts a consolidation of all fil...

Page 40: ...for each of the top ten file systems that are in the composite file system graphs A 3 month view is provided This graph can be helpful in understand the dynamics of file system usage and in making fi...

Page 41: ...s graph displays the average of disk I O per second rates during each hour for the specified period This will allow you to evaluate if your workload is I O intensive or CPU intensive by comparing this...

Page 42: ...Graph This graph displays the processor usage per I O during each hour for the specified period This will allow you to evaluate if your workload is I O intensive or CPU intensive by comparing this gr...

Page 43: ...essor Utilization Disk Usage File System Usage and Memory Utilization for the specified period The number of months growth remaining until the respective metric is projected to reach the guideline is...

Page 44: ...ll measured days for the period Peak Average percent utilization is an average of the two busiest shift hours of all workloads combined for all measured days in the period The graph shows the current...

Page 45: ...hs prior history if available The color of a bar in a certain month is the projected status of that resource for that month Color Percentage Disk Space Usage Green 74 or less used Yellow 75 to 84 used...

Page 46: ...tatus of that resource for that month Green means the resource usage will be in the acceptable range Yellow means the resource usage is marginal and will need attention in the near future Red means th...

Page 47: ...ull function fee access to PM each graph category tab can be clicked on to select the type of graph to work with If the server or partition is only entitled for summary service the MSG tab will be the...

Page 48: ...nline transaction processing OLTP when referencing interactive CPW or interactive capacity Interactive Plus System Utilization In general it is typical to experience long and unpredictable interactive...

Page 49: ...ng measured Interactive Utilization Guidelines The Processor Interactive Capacity guidelines are based on the following table Guideline for Interactive Utilization Average Marginal 70 Average Critical...

Page 50: ...w Guidelines for System and Interactive Utilization Number of Processors Average Marginal Average Critical Peak Marginal Peak Critical 1 45 60 56 70 2 60 75 72 83 3 67 81 80 88 4 71 85 81 91 4 75 90 8...

Page 51: ...e shift for the reported day expressed as a percentage of total processor capability The left side of the graph shows the usage values in CPW and the right side shows the value as a percentage of assi...

Page 52: ...00 through 08 59 The black line shows the busiest hour of interactive peak utilization for that hour during the last 30 day period expressed as a percentage of the total processor capability It is li...

Page 53: ...he level of processor utilization that is considered critical The black diamond shows the average of the two busiest hours per shift during the month in CPW values On the trend months the growth trend...

Page 54: ...lash green at the bottom shows the level of processor utilization that is considered acceptable The crosshatch yellow in the middle shows the level of processor utilization that is considered marginal...

Page 55: ...zation based on the last six months utilization The yellow star shows the calculated peak processor utilization based on the last 12 months utilization The recommended guidelines for marginal and crit...

Page 56: ...aused by A high number of faults compared to other synchronous input output I O The partition does not have enough memory A high service time at the disk operation level The structure of the applicati...

Page 57: ...aulting in a percent for each day for the last three months or the period you choose The Peak represents the single busiest hour during the shift The information under the Facts heading at the bottom...

Page 58: ...the period you choose The average of the hours is indicated by the forward slash blue column Each hour s heaviest paging peak during the period is indicated as a line black The straight red line is th...

Page 59: ...s When disks are fragmented data is retrieved from several places when a block of records is requested This takes time and keeps the disk arms busy The size of the disk drives o You can have sufficien...

Page 60: ...e information under the Facts heading at the bottom of the graph states the recommended guidelines for marginal and critical peak utilization and the months calculated to reach this guideline with you...

Page 61: ...last month or the month you select The information under the Facts heading at the bottom of the graph states the recommended guidelines for marginal and critical peak utilization By using the Customi...

Page 62: ...ee month trend projection for the two busiest hours per measured day during the period The trend months are the last three months shown The symbols used on this graph are explained as follows The forw...

Page 63: ...sk arm utilization based on the utilization of the last three months The blue square shows the calculated peak disk arm utilization based on the utilization of the last six months The yellow star show...

Page 64: ...ecessary data A sudden increase in data usage shows clearly on disk usage graphs It might not be highlighted on either the Management Summary Graph or the months to guideline calculations because of t...

Page 65: ...or marginal and critical peak percentage are stated under the Facts section at the bottom of the graph It indicates the number of months before this system reaches the guideline It also shows the chan...

Page 66: ...mbols used on this graph are explained as follows The forward slash green area in the bottom of the graph shows the disk space utilization that is acceptable The cross hatch yellow area in the middle...

Page 67: ...nd on the trend months shows the calculated disk space utilization growth based on the three last months utilization The blue square shows the calculated disk space utilization based on the last six m...

Page 68: ...ent to be shown in the graph The Y axis shows the name of each communication line that is in use The X axis shows the average line utilization in percent The percentage of errors that occurred on the...

Page 69: ...help plan for future changes in business volumes if you find that a 20 increase in business volumes leads to a 40 increase in transaction rates Observe changes in transaction volumes when adding new...

Page 70: ...ive transaction volume per hour for each day during the last three months The thick red line shows the average transaction volume for the hour that had the most transactions for each day during the la...

Page 71: ...r and Trending Graph The Transaction Volume per Hour History and 3 Month Trend graph shows the average number of transactions per hour over a period of 13 months The trend for the next three months is...

Page 72: ...n must wait for a synchronous disk I O to complete before it can continue processing On the other hand a transaction can continue processing when an asynchronous I O is requested As a result even the...

Page 73: ...ber of synchronous I Os are shown A transaction must wait for a synchronous disk I O to complete before it can continue processing On the other hand a transaction can continue processing when an async...

Page 74: ...onous I Os A transaction must wait for a synchronous disk I O to complete before it can continue processing On the other hand a transaction can continue processing when an asynchronous I O is requeste...

Page 75: ...mber of pages printed to the printer The difference in the number of pages can be attributed to the fact that output queue jobs can be canceled never printed or printed multiple times Additionally the...

Page 76: ...batch jobs The Facts section at the bottom of each graph shows the current and previous two months Review this information for trends or significant changes You can choose from the following graphs N...

Page 77: ...of batch jobs per measured day The Facts section of the graph displays the job characteristics for the current and previous two months It also shows the CPU time in seconds the average number of I Os...

Page 78: ...ob begins when a job becomes active from the job queue The Facts section of the graph displays the job characteristics for the current and previous two months It also shows the CPU time in seconds the...

Page 79: ...month plus the last two months The average characteristics shown include CPU time per I O number of I Os per second and number of synchronous I Os per second A transaction must wait for a synchronous...

Page 80: ...data traffic to and from other work stations on the line How frequently the system polls the control unit for input data 2 This step indicates the Start of Transaction SOT In addition the system perf...

Page 81: ...ut operation with DFRWRT NO in the display file description Output operation with the DDS INVITE keyword Combined output input operation for example an Execute Format EXFMT operation in an RPG 400 pro...

Page 82: ...per Measured Day graph shows the internally measured IBM i response time average for all the interactive jobs for each day for the last three months The Facts section shows the average response time...

Page 83: ...ws the internal IBM i average response time for all users for each hour You can select a maximum range of 31 days on this graph when using the Customize Graph function The Facts section shows the aver...

Page 84: ...vailable Local Response Time graphs include Average Response Time per Measured Day Average Response Time by the Hour Note If you do not have twinax devices these graphs are empty 80 PM for Power Syste...

Page 85: ...per Measured Day graph for local terminals shows the response time of the system for local terminal users traditional displays attached with twinax cables This includes all the 5250 type terminals and...

Page 86: ...aph for local terminals shows the response time of the system for local terminal users traditional displays by hour Displays must be attached via twinax This includes all the 5250 type terminals and t...

Page 87: ...tems Local Response Time reports and graphs include Average Response Time per Measured Day Average Response Time per Hour Attention If PCs are connected using the TCP IP protocol these graphs are empt...

Page 88: ...ge Response Time Graph This graph shows the response time of the system for all PC users connected using Systems Network Architecture SNA protocols The chart illustrates the average response time for...

Page 89: ...esponse Time Graph This graph shows the response time of the system for all PC users connected using Systems Network Architecture SNA protocols The chart illustrates the average response time for each...

Page 90: ...Volumes Transaction Analysis I O Transaction Analysis Processor Time Batch Jobs Processor Time Batch Jobs I O Batch Jobs Most Frequent System Values System Resources Summary Print Queue Jobs Printed D...

Page 91: ...sponse Time Response Time Chart The Response Time chart shows the 10 users with the longest combined response times in seconds during the measured period PM for Power Systems Graph Reference Document...

Page 92: ...Average Response Time Average Chart The Response Time Average chart shows the 10 users with the longest average response times in seconds during the measured period 88 PM for Power Systems Graph Refer...

Page 93: ...Transaction Volumes Transaction Volumes Chart The Transactions Volume chart shows the 10 users with the most transactions during the measured period PM for Power Systems Graph Reference Document 89...

Page 94: ...ion Analysis I O Transaction Analysis I O Chart The Transaction Analysis I O chart shows the 10 users with the most I Os per transaction in the measured period 90 PM for Power Systems Graph Reference...

Page 95: ...time Transaction Analysis Processor Time Chart The Transaction Analysis Processor Time chart shows the 10 users with the most processor time per transaction in the measured period PM for Power System...

Page 96: ...essor Time Batch Jobs Processor Time Chart The Batch Jobs Processor Time chart shows the 10 batch jobs with the most processor time per job during the measured period 92 PM for Power Systems Graph Ref...

Page 97: ...Batch Jobs I O Batch Jobs I O Chart The Batch Jobs I O chart shows the 10 batch jobs with the most I Os per second during the measured period PM for Power Systems Graph Reference Document 93...

Page 98: ...Jobs Most Frequent Batch Jobs Most Frequent Chart The Batch Jobs Most Frequent chart shows the 10 batch jobs that ran most frequently in the measured period 94 PM for Power Systems Graph Reference Doc...

Page 99: ...This is a graph of the jobs with the most pages sent to the out queue This is not necessarily equivalent to pages printed as out queue jobs can be cancelled or saved prior to printing PM for Power Sy...

Page 100: ...Printed Documents per User Printed Documents per User This is a graph of the top 10 users with the most documents sent to the print queue 96 PM for Power Systems Graph Reference Document...

Page 101: ...egory of IBM i system values Use QPFRADJ to specify when to automatically adjust memory pools and activity levels Activity level refers to the maximum number of threads that can compete for memory and...

Page 102: ...ontains a discussion about the job logs and how to remove them for jobs that complete normally Knowledge of the job remains in the system and counts toward the DSPSYSSTS value as long as a job has one...

Page 103: ...rting period The peak average values represent the averages of the utilization summaries for the highest two hours for each shift of each day in the reporting period The maximum values represent the m...

Page 104: ...charge PM for Power Systems offering See the Levels of Service topic above refer to Table of Contents The drop down options in the interactive function include Processor Interactive Capacity Processor...

Page 105: ...ses the colors to indicate the current status of the resource and the projected status for the next 12 months Green bar resource utilization is within good performance guidelines Yellow bar resource u...

Page 106: ...ization is within good performance guidelines Yellow bar resource utilization is marginal you may be experiencing intermittent performance degradation due to the resource Red bar resource utilization...

Page 107: ...good performance guidelines Yellow bar resource utilization is marginal you may be experiencing intermittent performance degradation due to the resource constraint Red bar resource utilization is cri...

Page 108: ...and the projected status for the next 12 months Green bar resource utilization is within good performance guidelines Yellow bar resource utilization is marginal you may be experiencing intermittent pe...

Page 109: ...mpanies A current list of IBM trademarks is available on the Web at Copyright and trademark information at www ibm com legal copytrade shtml Adobe and PostScript are either registered trademarks or tr...

Reviews: