PD420 Target Verification and Lane Setup
STEP #3: Check target signal strength and location on the real time range plot.
After selecting the application (“Highway” or “Intersection”) and initializing the
background clutter map in the PD420 Setup Tab, click on the “PD420 Plot” tab. This will
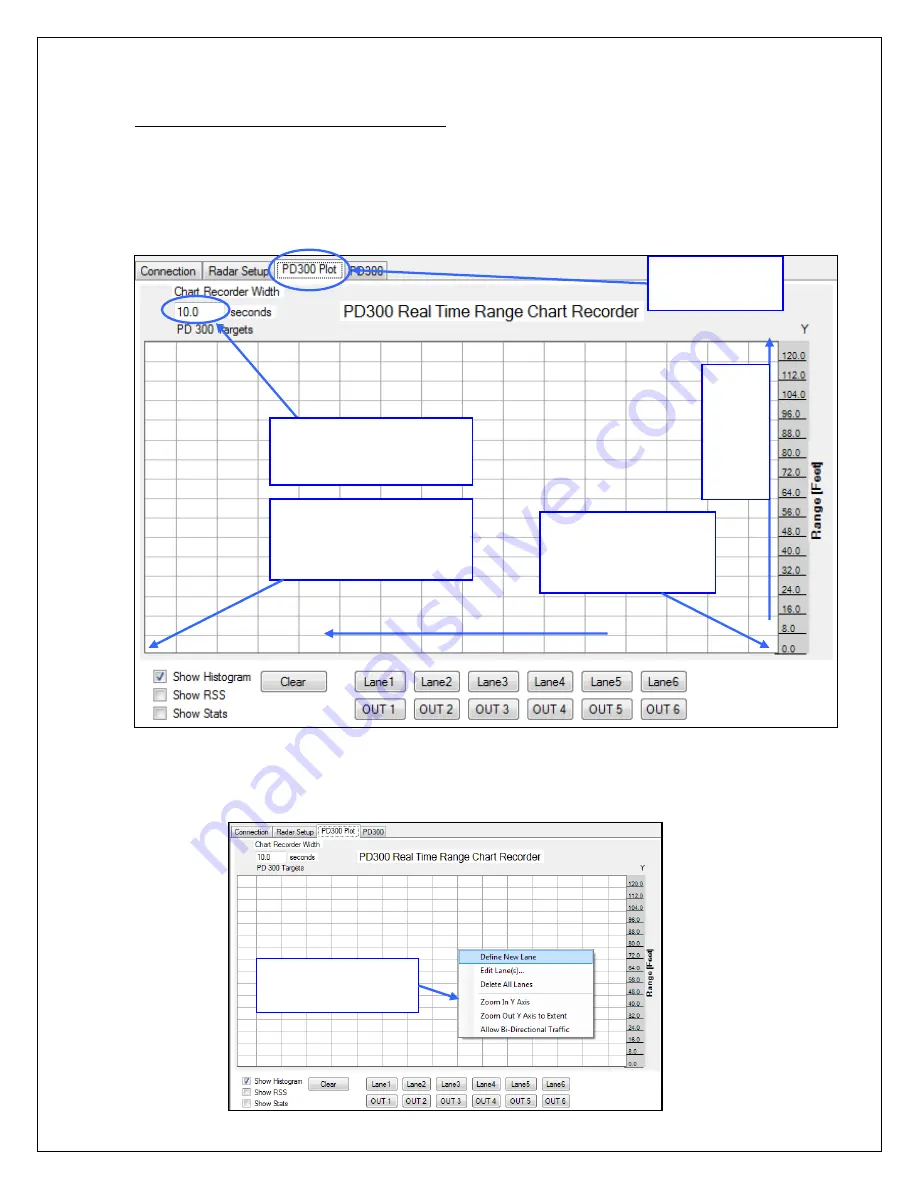
bring up a real time “chart recorder” type plot of tracked targets as shown below.
Please review the layout of the real time range plot above. All targets the radars detects in
front of it will be shown here as red lines. The actual real-time range is plotted. Every red
line is a target that is tracked by the radar. The plot keeps track of a specified amount of
history before targets are allowed to scroll off the left part of the screen.
Select how much history (in
seconds) is shown on the
chart.
Present (t=0) seconds.
This is what the radar is
“seeing” at this instant in
time in front of it.
Past (t = now
-
10 seconds).
This is what the radar “saw”
10 seconds ago. You may
change this in the box above.
PAST HISTORY. Time in seconds
Target
linear
range
from
face of
the
radar.
Right click to access
more options.
Select the “PD420
Plot” window.


