


14
Operating Modes
6.1
Graph
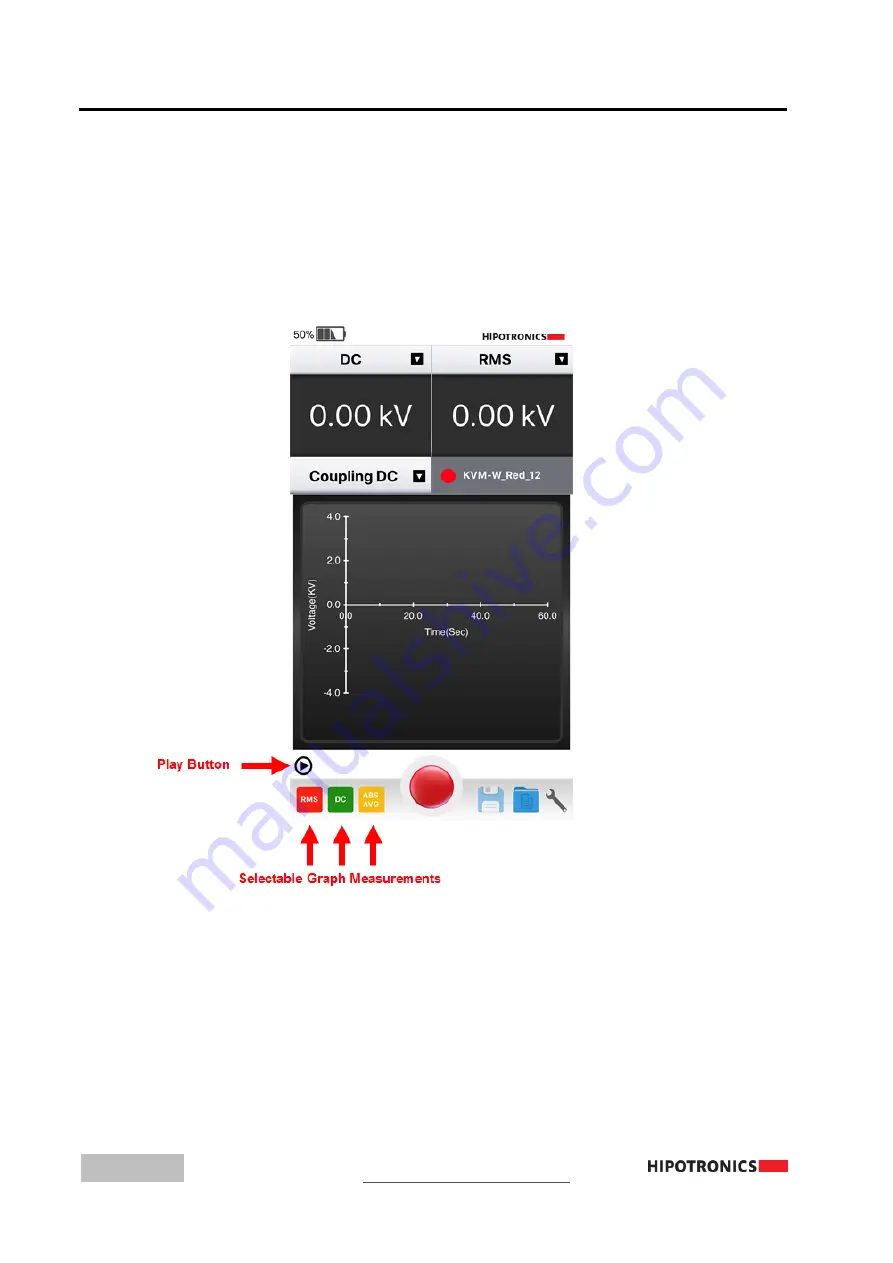
The app can record test data values for RMS, DC, and Absolute Average. To start recording, press the
Play button located to the bottom left of the graph display. The graph will then begin updating
automatically with incoming data values once per second. There are three selectable measurements to
display on the graph. In the bottom left corner of the screen, the labelled buttons indicate whether the
graph is plotting those values or not. To enable or disable any of those options, just click on the button.
A solid color indicates that the measurement is being plotted, and if the button is mostly transparent,
then it is disabled from the graph. The color of the button also correlates to its respective plotted line
color on the graph.
Once the Play button is pressed, the graph will begin updating, a Pause button will replace where the
Play button just was, and a Reset button will appear under the right corner of the graph display. To stop
recording values, press Pause. This will then replace the Pause button with the Play button. When
ready to resume the test and continue recording values, press Play again. To reset the test and start a
fresh recording of measurement values and graph, press Reset.


