25
1019658 11/2014
4.4 Efficiency Versus Load
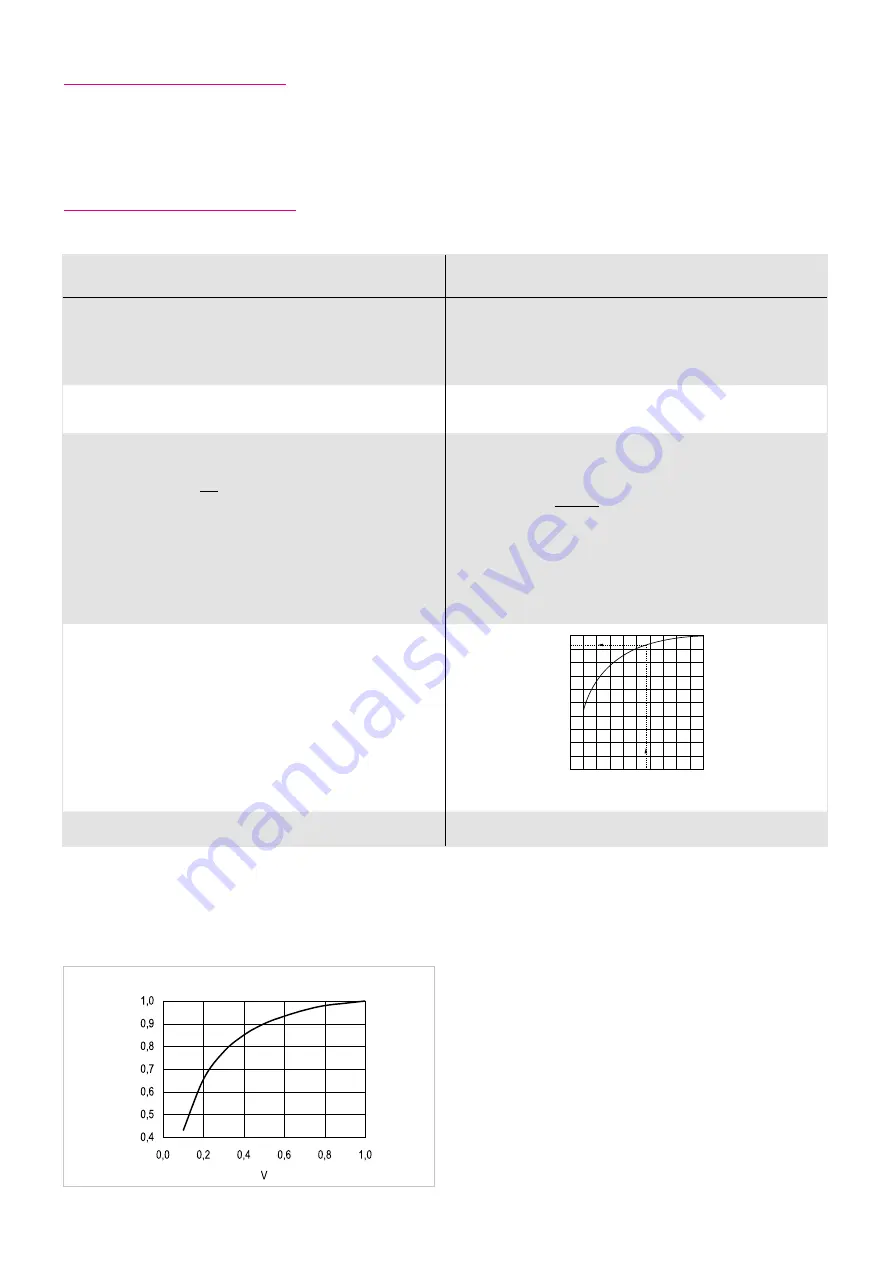
Efficiency for Harmonic Drive® Gears varies depending on the output torque. The efficiency curves are for gears operating at
rated output torque. Efficiency for a gear operating at a load below the rated torque may be estimated using a compensation
curve and equation as shown on the next page.
4.4.1 Efficiency Calculations
Calculation Procedure
Example
Efficiency of HFUC-20-80-2A-GR with
input speed n=1000 rpm
output torque T=19.6 Nm at 20° C ambient temperature.
Lubrication: Oil
The efficiency may be determined
using the efficiency graphs.
From matching chart
η
= 78 %
Calculate
the torque factor V.
With:
T
av
= Average torque
T
N
= Rated torque at rated speed
T
av
= 19.6 Nm
T
N
= 34.0 Nm
K depending on gear type and V,
see illustration 25.4
Efficiency
η
L
=
η
. K
η
L
= 78 . 0.93 = 73 %
[Equation 25.2]
[Equation 25.3]
Calculating Factor K
V =
T
av
T
N
K
Table 25.1
1.0
0.8
0.6
0.2
0
0.2 0.4 0.6 0.8
V
K
0.4
1.0
V =
= 0.57
19.6 Nm
34.0 Nm
Illustration 25.4


