16
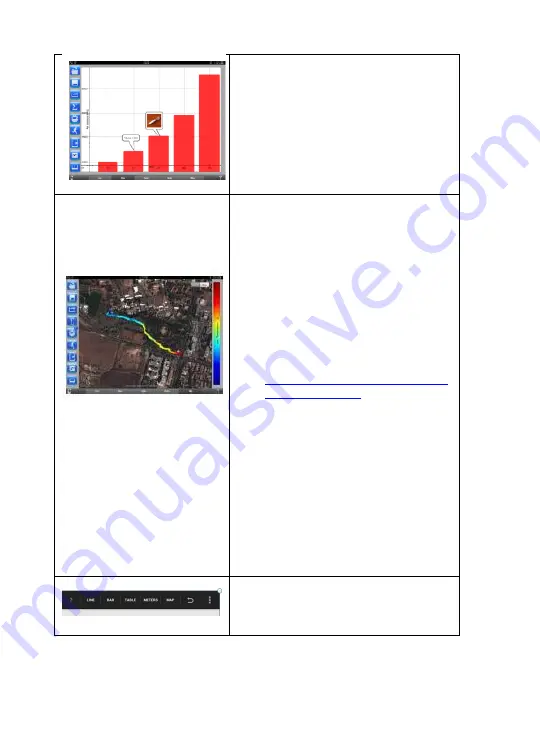
Graph annotation
Use a long touch on the background (not
on a graph) to create an annotation. Touch
the box to open the annotation editing box.
Here you can:
1.
Edit or write an annotation.
2.
Add an image using the camera or
the image gallery.
3.
Remove the annotation.
*
NOTE:
Without an Internet
connection, GPS data can be
collected but cannot be
displayed over Google maps.
Use of Map View
Recording GPS together with other sensors
enables the
GlobiLab
software to display
these sensors data over the Google maps.
1.
Make sure the tablet is connected to
the Internet.
2.
Tap the
Open
icon and select “Walk in
the Park”. This experiment measured
the climate in a city park compared to
a nearby city cross-road. For more
details check the Microclimates
movie at:
http://www.globisens.com/resources
/experiment-videos
3.
Tap the color scale on the left and
select
Ambient Temperature
.
Observe the temperature change
while walking from the city cross-road
to the park.
4.
Tap the colored dots on the map to
get a marker with the temperature
value.
5.
Pinch to zoom the map in or out.
6.
See the experiment data in a table by
tapping the Table View and observe
the GPS longitude and latitude values.
Help
Tap the ? at the left end of the menu bar in
the upper right corner of the screen to
open the Help document.


