


12
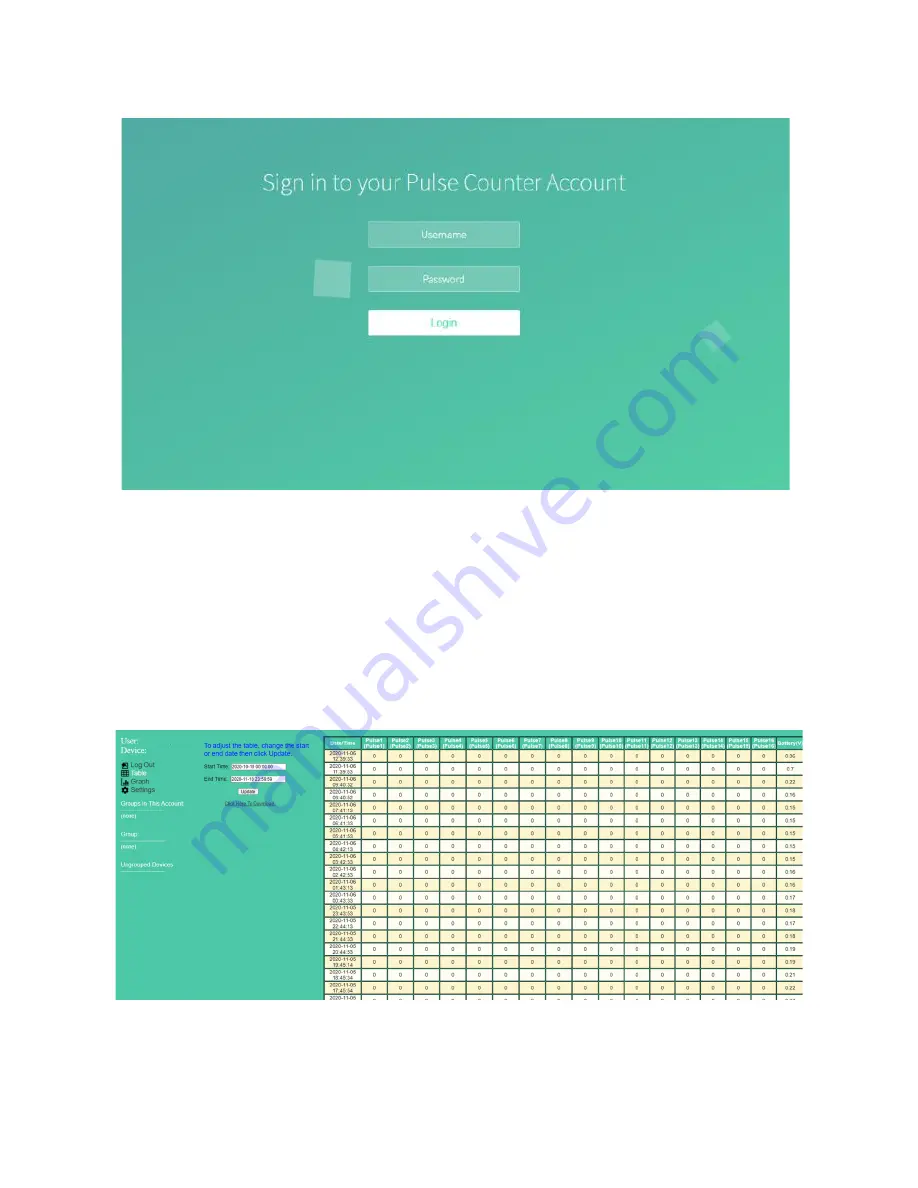
Upon entering the login credentials,you will be taken to the home page of the sitethat displays all the devices
connected to theiraccountshown in figure6.This page displays the number of pulses present in each input counter
and the time at which the reading was uploaded.You can filter by start and end time to view just the data
uploaded during a specific daterange.You can export this data as an Excel sheet(*.csv file) by simply clicking on the
“Click Here to Download” icon.
The data can also be viewed in a
graphical format by clicking on the “Graph” button
on the left side of the webpage. You can select any input from the drop-down menu along with the time interval
and the time duration. The data will be displayed in the form of a line graph as shown in figure7 and you can
download the image (*.png file) for reference. This will provide a better visual representation of the data to help
you recognize usage patterns easily.
Figure 7: Multi Pulse Counter data webpage showing the number of pulses in each input counter
Figure 6: Show the login page of the Multi Pulse Counter data server.