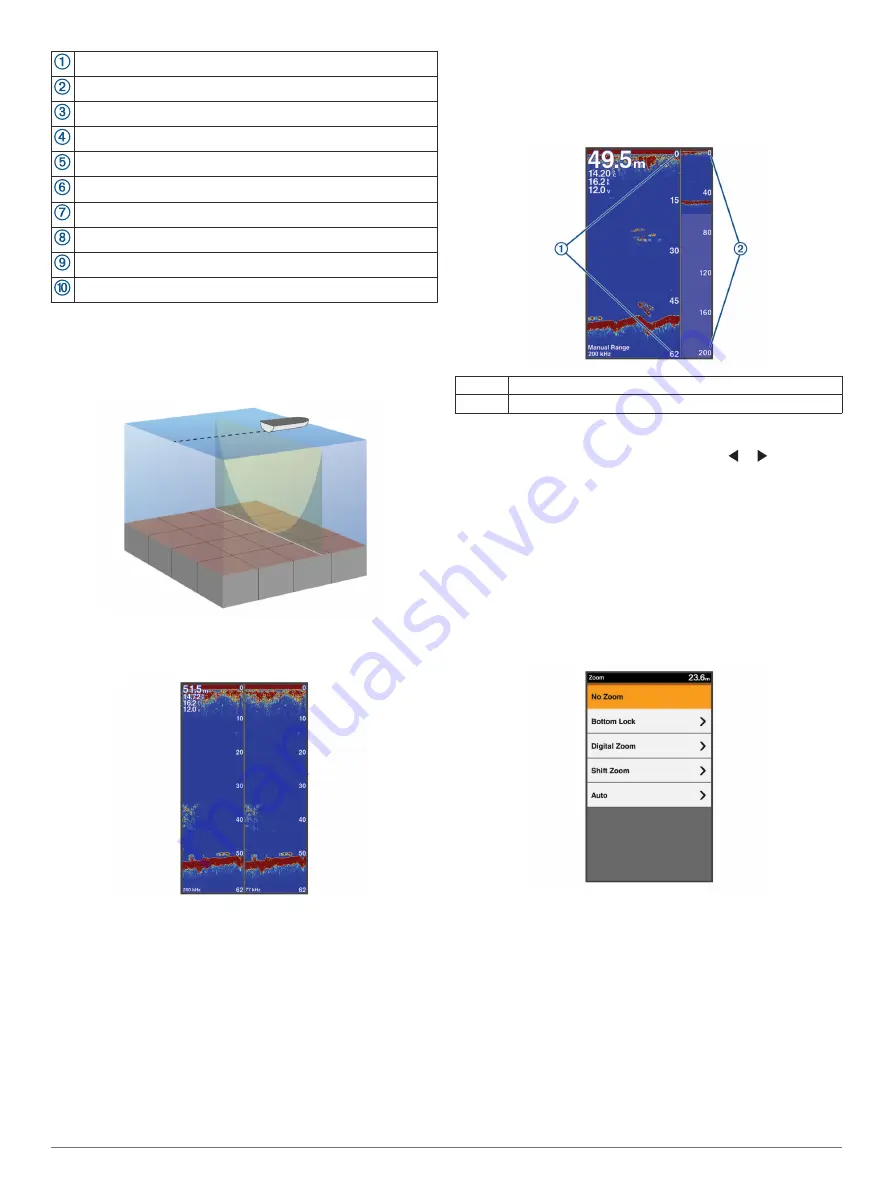
Bottom depth
Water temperature
GPS speed
Device voltage
Time
Suspended targets (fish)
Depth line
Transducer type and frequency, and zoom type
Depth indicator as the sonar data screen scrolls from right to left
Bottom echo
Traditional transducers emit a conical beam. The Garmin
ClearVü scanning sonar technology emits two narrow beams,
similar to the shape of the beam in a copying machine. These
beams provide a clearer, picture-like image of what is around
the boat.
Split-Screen Frequency
You can view two frequencies from the split frequency screen.
Shift-Zoom View
On the sonar screen, you can see a full-view graph of sonar
readings on the right side of the screen, and a magnified portion
of that graph on the left side of the screen.
Shift allows you to set the depth range on which the sonar is
focused. This allows you to zoom in a higher resolution in the
focused depth.
When using shift, bottom tracking may not work effectively,
because the sonar looks for data within the depth range of the
focused area, which may not include the bottom. Using shift also
can impact the scroll speed, because data outside the depth
range of the focused area is not processed, which reduces the
time required to receive and display the data. You can zoom in
to the focused area, which enables you to evaluate target
returns more closely at a higher resolution than just zooming
alone.
The shift-zoom view is not available on all sonar screens.
From a sonar screen, select
ZOOM
>
Shift Zoom
.
À
Zoomed depth scale
Á
Depth range
Pausing the Sonar
From the
Traditional
sonar screen, select or .
Adjusting the Zoom
You can adjust the zoom manually by specifying the span and a
fixed starting depth. For example, when the depth is 15 m and
the starting depth is 5 m, the device displays a magnified area
from 5 to 20 m deep.
You also can allow the device to adjust the zoom automatically
by specifying a span. The device calculates the zoom area from
the bottom of the water. For example, if you select a span of
10 m, the device displays a magnified area from the bottom of
the water to 10 m above the bottom.
1
From a sonar screen, select
ZOOM
.
2
Select an option:
• Select
Bottom Lock
to lock the screen to the water
bottom.
• Select
Manual
or
Digital Zoom
to manually set the zoom.
• Select
Auto
to automatically set the zoom.
• Select
Shift Zoom
to manually adjust the zoom.
Locking the Screen to the Water Bottom
You can lock the screen to the water bottom. For example, if you
select a span of 20 meters, the device shows an area from the
water bottom to 20 meters above the bottom. The span appears
on the right side.
1
From a sonar view, select
MENU
>
ZOOM
>
Bottom Lock
.
2
Select a span.
Sonar
3
Summary of Contents for FF 350 Plus
Page 1: ...FF 350 Plus Owner s Manual...
Page 4: ......


