Fancom 747
8. Data presentation
34
Readout of uniformity and growth
1.
Press
History uniformity/growth
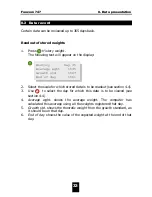
The following text will appear on the display:
2.
Select the scale for which stored data is to be readout (see section 4.4).
3.
Use to select the day for which this data is to be viewed (see
section 4.4).
4.
Growth/day
shows the average animal growth in grams that day.
5.
CV
shows the computer calculated co-variance that day.
6.
Unif.
shows the percentage of all the measurements that were within
10% of the average weight that day.
7.
Measurements
shows the number of measurements that have been
accepted by the computer at all the scales that day.
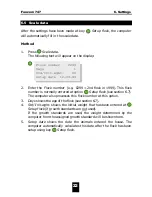
History Day 35
Growth/day 53
CV 10.0 Unif. 72
Measurements 182


