background image

MLT-1000 User Manual 

Overview 

Excel Technology Co 

Page 

11


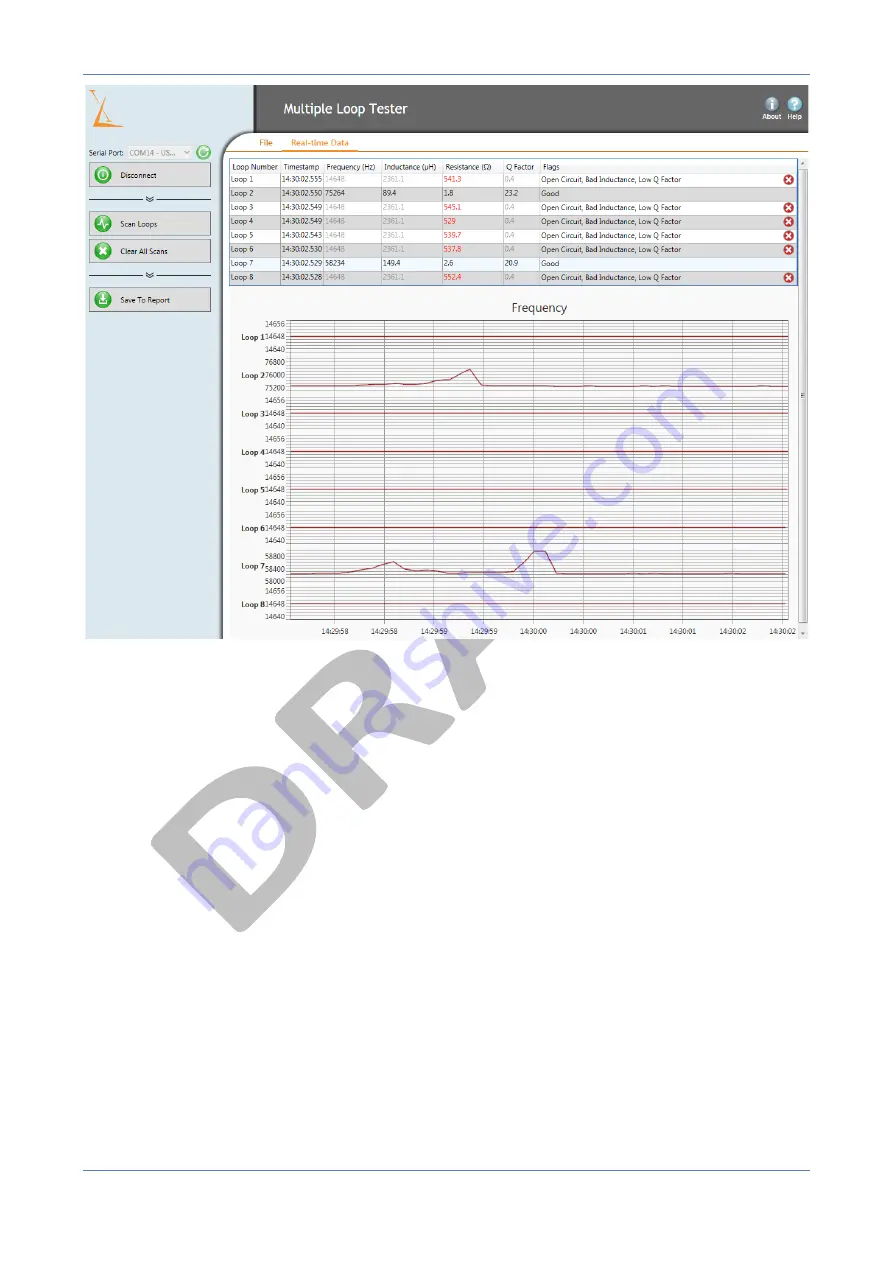
Figure 1.10: 

Real-time data view. 

The real-time data view is for viewing data only, so data cannot be saved. In order to get a snapshot of 
data, perform a scan instead. 


1.3.8


Quick Start Steps  

1.


Firmly connect one end of the 16 way flat ribbon cable to the loop termination panel with the other 
end connected to the MLT-1000.  

2.


Plug the micro-USB cable into the MLT-1000 and connect it to a PC USB port. The red 

Power

 LED 

will illuminate, indicating that the device is powered.  

3.


Open the Multiple Loop Tester Interface and select the device from the list of serial ports (press 

Refresh 

if the device is not visible). Click 

Connect

 and the green 

Status 

LED should flash three times, 

indicating that the device is connected to the PC.  

4.


Click 

Scan Loops

 to initiate a scan. After entering any useful/relevant information about the scan, 

the device will scan all connected loops (ten times per second for five seconds). 

5.


At  any  time  the  user  may  save  the  previously  measured  data.  To  do  this,  click  the 

Save  to  CSV


button and a report will be generated in a csv format containing the loop data acquired during that 
session.  

Summary of Contents for MLT-1000

Page 1: ...Document Revision A MLT 1000 Multiple Loop Tester MLT 1000 User Manual ...

Page 2: ...at Excel Technology Co Pty Ltd deems necessary to support the relevant specification and warranty Excel Technology Co Pty Ltd acknowledges the proprietary information provided by Third Party component suppliers however Excel Technology Co Pty Ltd assumes No Responsibility for the use of any other circuit or device other than the circuitry embodied on Excel Technology Co Pty Ltd numbered engineerin...

Page 3: ...erview 3 1 1 Terminology 3 1 2 Physical Layout 4 1 3 Usage 5 1 3 1 Connecting to the MLT 1000 5 1 3 2 Scanning Using the MLT 1000 6 1 3 3 Configuring Data 8 1 3 4 Removing Outlier Data Optional 8 1 3 5 Exporting Data 9 1 3 6 Saving Raw Frequency Data 10 1 3 7 Real time View 10 1 3 8 Quick Start Steps 11 ...

Page 4: ...erty of a conductor that opposes a change in current Inductance is measured in Henries H but is commonly displayed in Microhenries µH Inductance depends on the size number of turns configuration of the loop length of the feeder cable and environmental factors e g steel reinforcement in road temperature DC series resistance is a property of a conductor that opposes current flow The resistance of a ...

Page 5: ...Co Page 4 1 2 Physical Layout Figure 1 0 a Top face b side face c Loop end face d PC end face Figure 1 1 IDC connector pin layout Loop 1 Loop 1 Loop 2 Loop 2 Loop 3 Loop 3 Loop 4 Loop 4 Loop 5 Loop 5 Loop 6 Loop 6 Loop 7 Loop 7 Loop 8 Loop 8 a b c d ...

Page 6: ...wers on and initialises when plugged into a USB port of a PC Similarly unplugging the device will cut the power and turn it off The red Power LED indicates whether power is being supplied to the device When connecting the MLT 1000 to a PC for the first time it may be necessary to install additional device drivers If driver installation does not happen automatically they can be manually downloaded ...

Page 7: ...anufacturer can be entered This metadata will be included when exporting the loop data to the report Figure 1 4 Scan description dialogue box Once the desired loops are connected to the device to initiate a scan click the Scan Loops button The user will be prompted to enter a scan description Figure 1 4 then a five second scan of all connected loops will begin Figure 1 5 Any empty loop channels wi...

Page 8: ...T Software Interface The MLT 1000 rapidly switches between all eight channels and measures frequency and resistance sequentially The status LED will flash each time all eight channels have been scanned This process is repeated 30 times per second for five seconds Figure 1 6 shows the output after a single scan ...

Page 9: ...iption click the empty box in the Loop Description column and enter a value Press the Enter key or click out of the box in order to save the value This value will then be exported along with the full report This may be used to add identifying information to individual lanes for example Southbound 1 The Flags column indicates if a loop is faulty 1 3 4 Removing Outlier Data Optional If a vehicle is ...

Page 10: ...points using the checkboxes highlighted blue in Figure 1 8 1 3 5 Exporting Data To save the scan results to a report click the Save To Report button The report is generated as a comma separated value CSV file and can be viewed with any text or spreadsheet editor The user will be prompted to choose a location to save the file and a filename Select a save location and file name and click Save The co...

Page 11: ...ave location and file name and click Save The frequency file only stores frequency data for a single scan To save data for multiple frequency scans each file must be saved separately The data saved in this file is only frequency data For metadata such as loop descriptions please refer to the scan results CSV 1 3 7 Real time View To view the loop data for all eight channels in real time click the R...

Page 12: ...lluminate indicating that the device is powered 3 Open the Multiple Loop Tester Interface and select the device from the list of serial ports press Refresh if the device is not visible Click Connect and the green Status LED should flash three times indicating that the device is connected to the PC 4 Click Scan Loops to initiate a scan After entering any useful relevant information about the scan t...

Reviews: