background image

User Manual 


7   Logged Data Files 

The measurement data file is formatted as a comma separated values file (.csv), allowing for easy


importing into spreadsheet or plotting software. 


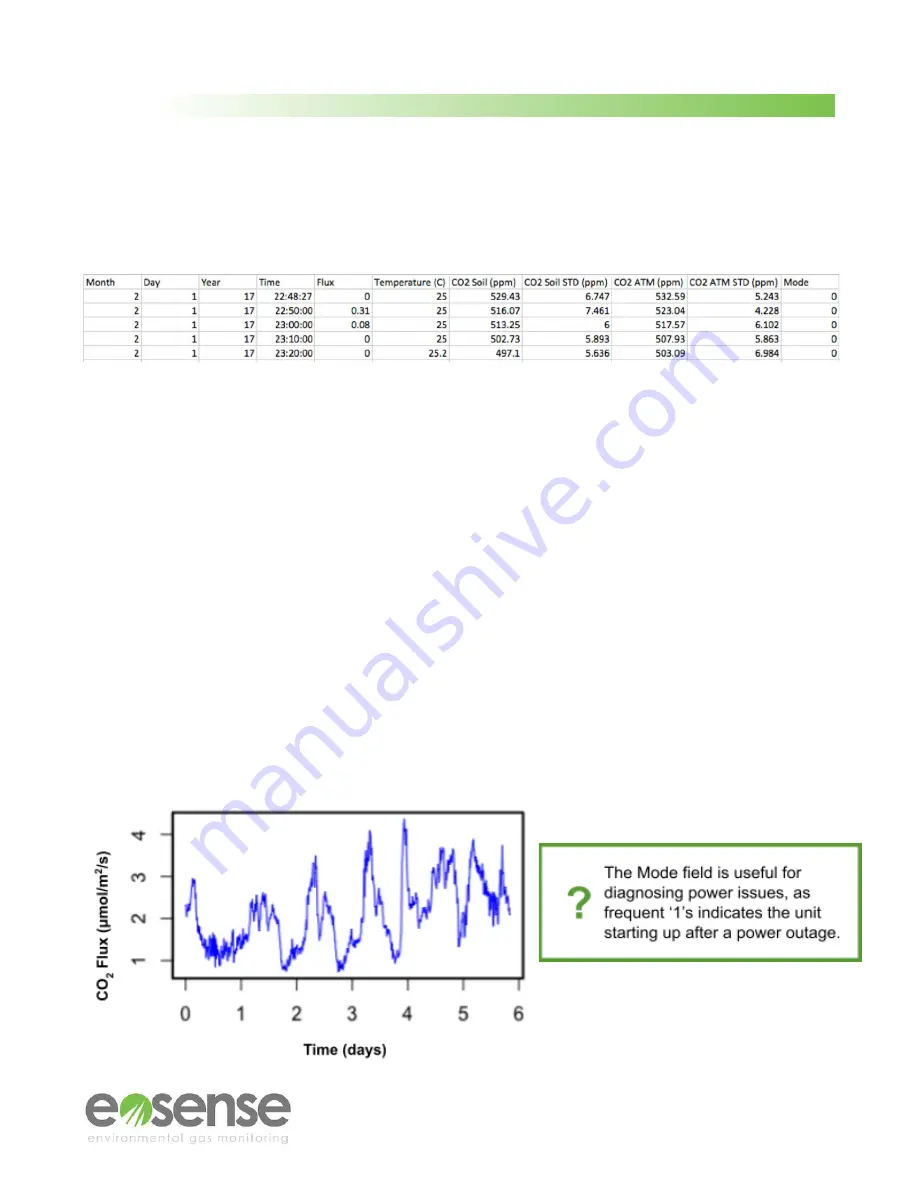
Figure 26

 Example eosFD data, viewed as a spreadsheet


Month

The month in which the measurement was collected. 

Day

The day of the month in which the measurement was collected. 

Year

The year in which the measurement was collected. 

Time

The time at which the measurement occurred (24 hour clock). 

Flux

The estimated CO

2

 flux rate from the soil surface in μmol m−2s−1. 

Temperature

The approximate internal temperature of the eosFD in ◦C. 

CO2_Soil

The soil surface CO

2

 signal in ppm, only used for flux calculation. 

CO2_Soil_STD

The standard deviation of the soil surface concentration of CO2 in ppm.  

CO2_ATM

The atmospheric CO

2

 signal in ppm, only used for flux calculation. 

CO2_ATM_STD

The standard deviation of the atmospheric concentration of CO2 in ppm.  

Mode

A status indicator showing when events occur (e.g. power outages): 

0: Normal measurement data 
1: Unit startup / power cycle 
2: eosLink-FD connection detected 
10-19: Unit startup with error code (contact Eosense Support)  

Soil & ATM


VR/VA

Four columns of raw voltages for troubleshooting purposes. 


Example flux data showing diurnal variation: 


24


[email protected]

© Eosense Inc.


Summary of Contents for eosFD

Page 1: ...User Manual eosFD eosFD Forced Diffusion Chamber and Software ...

Page 2: ...within one 1 year from date of delivery to the customer The customer shall assume all costs of removing reinstalling and shipping defective products to Eosense where applicable Eosense will return said products by surface carrier prepaid This warranty is in lieu of all other warranties expressed or implied This product complies with the following directives for CE Marking 2011 65 EU RoHS2 2015 863...

Page 3: ...D Housing 9 4 2 Main Power and Data Cable 9 4 3 Power Connectors 10 4 4 Data Cables 10 4 5 Analog Data 11 5 Deployment 12 5 1 Setup 12 5 2 Maintenance 13 6 Using eosLink FD 14 6 1 Overview 14 6 2 Installing and Connecting 14 6 3 Using the eosLink FD Interface 14 6 3 1 Menus 15 6 3 1 Buttons 20 6 3 1 Status Bar 23 7 Logged Data Files 24 8 Troubleshooting 25 2 support eosense co m Eosense Inc ...

Page 4: ...8 352 8313 https eosense com contact support Want to jump right into collecting flux measurements Section 3 Quick Start Guide tells you all you need to know to start out For best results we do recommend you read the entire manual Want to learn more about customizing your eosFD measurements Section 6 Using eosLink FD explains how to change the measurement frequency and collect data as well as other...

Page 5: ...flux rate can be calculated Unlike other automated chambers that lift and lower onto the soil surface the Forced Diffusion approach does not require external moving parts allowing it to be deployed in the harshest climates for extended periods without intervention 2 2 How is Flux Calculated Forced diffusion flux is calculated by calibrating the diffusive transport of gas across the eosFD s membran...

Page 6: ...sFD The other two windows lead to the Atmospheric Cavity which encircles the inner Soil Cavity but is isolated from direct exposure to soil gas When the measurement cycle occurs samples from these two cavities are drawn via internal pump to the NDIR CO 2 sensor for analysis before being returned to the original cavity These measurements are used to calculate the difference in concentration C For m...

Page 7: ...itted when the unit is turned on three short pulses or when the eosFD accepts a command or data from the eosLink FD software one longer pulse Please note that how frequently the eosFD pump is active will depend on your measurement frequency For the default 10 minute setting you will hear the eosFD alternate between long 20 second pump activation and shorter 2 second pulses This pattern will repeat...

Page 8: ...Connectors The eosFD should pulse the pump three times Connect the 3 pin end of the SSC Power and Data Cable to the USB RS232 Cable SSC Power and Data Cable DC Power Cable USB RS232 cable 2 Connect to the device using a Windows based PC the eosLink FD software and the included data cable 3 Check that the device s system time is set appropriately and choose a measurement frequency see Section 6 Usi...

Page 9: ... soil surface via the Mounting Ring 5 If using an external data logger to record FD measurements connect the purple wire for flux the blue wire for soil CO 2 concentrations and or the grey wire for temperature Each wire should be connected with one of the black grounding wires as a 0 5 VDC differential voltage measurement see Section 4 5 Analog Data 6 After the desired monitoring time period has e...

Page 10: ...any solvents such as alcohol as this can damage the probe s water resistance New eosFDs have one 12 pin socket If using an eosFD with two sockets one capped and the other uncapped be mindful to use the uncapped socket when connecting the eosFD to power and or the computer The capped socket is for troubleshooting purposes only and should not be used 4 2 Main Power and Data Cable The eosFD ships wit...

Page 11: ...lied voltage The average draw for a 10 minute cycle is 100 mA 1 2 W with a peak of 300 mA 3 6 W Figure 2 DC Power Cable 4 4 Data Cables Communication between eosLink FD and an eosFD uses the RS 232 Serial protocol The following components may be used to facilitate this interface SSC Power and Data Cable Included Used to power an eosFD as well as provide an RS 232 interface USB RS232 Cable Included...

Page 12: ...oil CO 2 via analog CO 2 values recorded by the eosFD are used only to calculate the flux and are not intended to be stand alone measurements of CO 2 In order to interpret the analog signals simply apply the appropriate linear transformation to the voltage data as determined by the range For example to transform a temperature voltage signal first divide the voltage by the 0 5 V range then multiply...

Page 13: ...tween the soil surface and the bottom of the eosFD can increase how long it takes the instrument to respond to changing flux rates Ideally a centimeter of space should be left to aid in installation of the eosFD itself as well as collar retrieval Inspection of the edges of the collar should show no significant gaps between the soil and collar though some near surface spacing is unavoidable Upon su...

Page 14: ...field with uncapped aux port 5 2 Maintenance The eosFD should be checked over monthly for best results Check the power supply and connection ensuring that the eosFD pump sounds when power is cycled In the event of fouling the eosFD membrane can be cleaned by first gently removing any particles using a dry non abrasive cloth Then use a damp no solvents cloth to gently remove any remaining dirt or s...

Page 15: ...r to launching eosLink FD however you may also refresh the program from the Connection menu You may have to refer to the Windows Device Manager if several serial port devices are connected to the computer and choose the correct port through Options Change COM Port Figure 7 eosLink FD Change COM Port window Once the port is selected the eosFD will automatically attempt to connect When the connectio...

Page 16: ... accuracy of measured flux rates Purge Time refers to the length of the purge cycle between atmospheric and cavity samples Number of Samples sets the number of concentration measurements from which the median concentration is taken Draw Time controls how long to allow for pump transport of gas from a soil or atmospheric cavity to the sensor for analysis Figure 8 The Pump Options window The Device ...

Page 17: ...on of CO 2 in ppm Temperature The approximate internal temperature of the eosFD in C ATM Soil Identity Atmosphere Identity 0 Soil Identity 1 Figure 10 Example of eosFD Alternating Cavity Data viewed as a spreadsheet The eosFD Settings File menu allows a calibration batch file concentration and flux to be uploaded to the eosFD or exported to a local file This functionality allows for easy restorati...

Page 18: ... current measurement frequency and start time will be shown along with the option to embed a command to synchronize the clock of the eosFD with the local PC when the template is applied Figure 12 Exporting an eosFD Template File To apply a template file to an eosFD choose Upload Template from the eosFD Template Files menu then navigate to a compatible file efd extension Once the file has been read...

Page 19: ...on displays a short explanation of the required procedure with the Start Check button used to launch the data collection Before proceeding ensure that the eosFD side windows and bottom opening are exposed to atmospheric air For best results avoid standing directly beside the unit during the Performance Check Figure 14 Starting an eosFD Performance Check test 18 support eosense co m Eosense Inc ...

Page 20: ...o under normal conditions while the Concentration Results will show an average CO 2 concentration near 400 ppm Differences between the concentration observed by the eosFD e g concentration drift can be resolved through the Upload Offset button though this is not necessary for accurate flux measurements due to the Forced Diffusion method Admin Mode allows the user to enter a password to enable addi...

Page 21: ...tion window allowing the user to choose a path and filename to store the logged data Once a location is selected the file transfer will begin Depending on the size of the data file this may take several minutes during which time a progress bar will be displayed over the main window to show estimated time remaining Collected data will be appended to the end of the selected file if it already exists...

Page 22: ... average flux and temperature values along with their standard deviations It also highlights any potential problems encountered such as frequent power cycling or unusual flux measurements e g very high or negative CO 2 fluxes This data can be exported to a text file using the Export Summary button Figure 20 An example eosFD data summary text file 21 support eosense co m Eosense Inc ...

Page 23: ... Time button in the upper right then click Apply Figure 21 The Set Time and Date window Button 3 Frequency This command allows the user to change the frequency of data logging by changing the amount of time that elapses between the beginning of measurements in minutes minimum of 5 minutes maximum of 1440 minutes or 1 day The user may also choose the starting time which is used to align the startin...

Page 24: ...ver seven months of data at the highest frequency every five minutes this should rarely be required Clearing the data periodically allows for quicker file transfers on subsequent uses This process will take 5 10 minutes Figure 24 The confirmation window for clearing store data 6 3 1 Status Bar The status bar found at the bottom of the eosLink FD program window is used to communicate status updates...

Page 25: ...ture The approximate internal temperature of the eosFD in C CO2_Soil The soil surface CO 2 signal in ppm only used for flux calculation CO2_Soil_STD The standard deviation of the soil surface concentration of CO2 in ppm CO2_ATM The atmospheric CO 2 signal in ppm only used for flux calculation CO2_ATM_STD The standard deviation of the atmospheric concentration of CO2 in ppm Mode A status indicator ...

Page 26: ...m still occurs please contact Eosense for additional guidance The eosFD housing or wires have been damaged what should I do Contact Eosense before attempting any repairs I am getting odd flux values how should I correct this The eosFD membrane may have become damaged or the CO 2 sensor calibration may have drifted unexpectedly Contact Eosense to see if recalibration is required The logged data fil...

Page 27: ...User Manual Eosense Inc 2A 10 Thornhill Drive Dartmouth Nova Scotia Canada B3B 1S1 Email support eosense com 888 352 8313 https eosense com contact support 26 support eosense co m Eosense Inc ...

Reviews: