User Manual
●
The
Record Concentrations
window has three suboptions;
Soil Cavity, Atmospheric Cavity,
and
Alternating
. These suboptions are convenient for troubleshooting purposes as it allows the
user to directly measure soil, atmosphere or alternating concentrations at a relatively high
frequency. While recording, a pop-up window displays the sampling measurements which
allows the user to monitor the concentrations live. When sampling is complete, the data will
automatically save to the eosLink-FD software folder.
Alternating
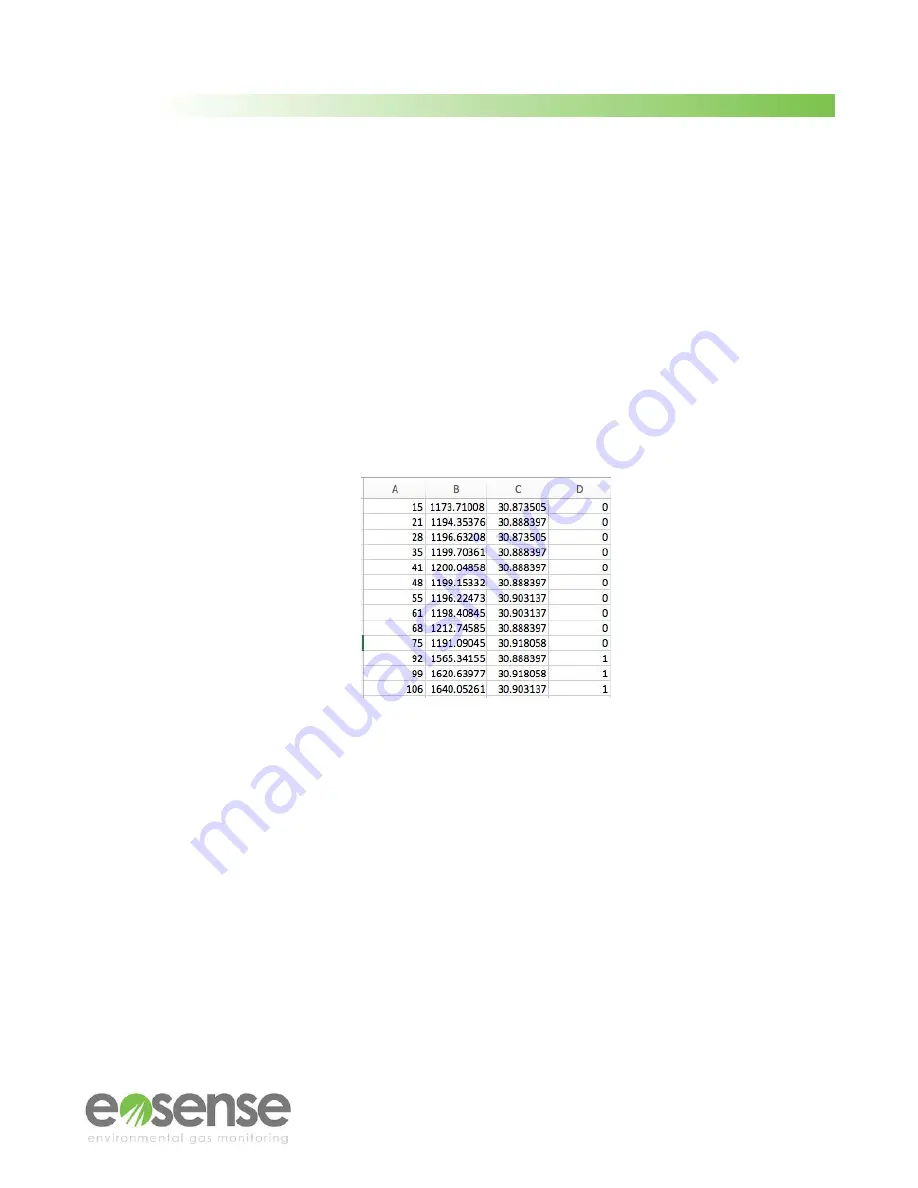
data will correlate atmosphere and soil concentrations by an identification number
(0 or 1) located in the fourth data column (Figure 10). The
Atmospheric Cavity
is identified by 0
and
Soil
Cavity
as 1.
The four columns of exported data include:
Time Elapsed
The time at which the measurement occurred (seconds)
Concentration
The soil/atmosphere concentration of CO
2
in ppm.
Temperature
The approximate internal temperature of the eosFD in °C.
ATM/Soil Identity
Atmosphere Identity (0) Soil Identity (1)
Figure 10
Example of eosFD Alternating Cavity Data, viewed as a spreadsheet
●
The
eosFD Settings File
menu
allows a calibration batch file (concentration and flux) to be
uploaded to the eosFD, or exported to a local file. This functionality allows for easy restoration
to factory calibration settings. To export a settings file, choose
Export Settings
. The eosFD
serial numbers and calibration parameters will be requested from the instrument, and then
displayed in a new window. Clicking the Export Settings will then allow you to choose a location
to save these values for future use.
To upload a settings file, choose
Upload File
from the menu, and then navigate to a compatible
file (.cal extension). The contained calibration settings will be read in and displayed beside the
current instrument parameters. Click the
Upload Settings
button to transfer the new coefficients
to the connected eosFD (see Figure 11).
16
m
© Eosense Inc.


