Statistics
3-10
Performance Graph
2.
Drag to select the desired mode: Percent Load, Percent Errors, or Percent
Collisions. The button label will change to reflect the new mode, and the bar
graph will refresh to display the current value.
Performance Graph
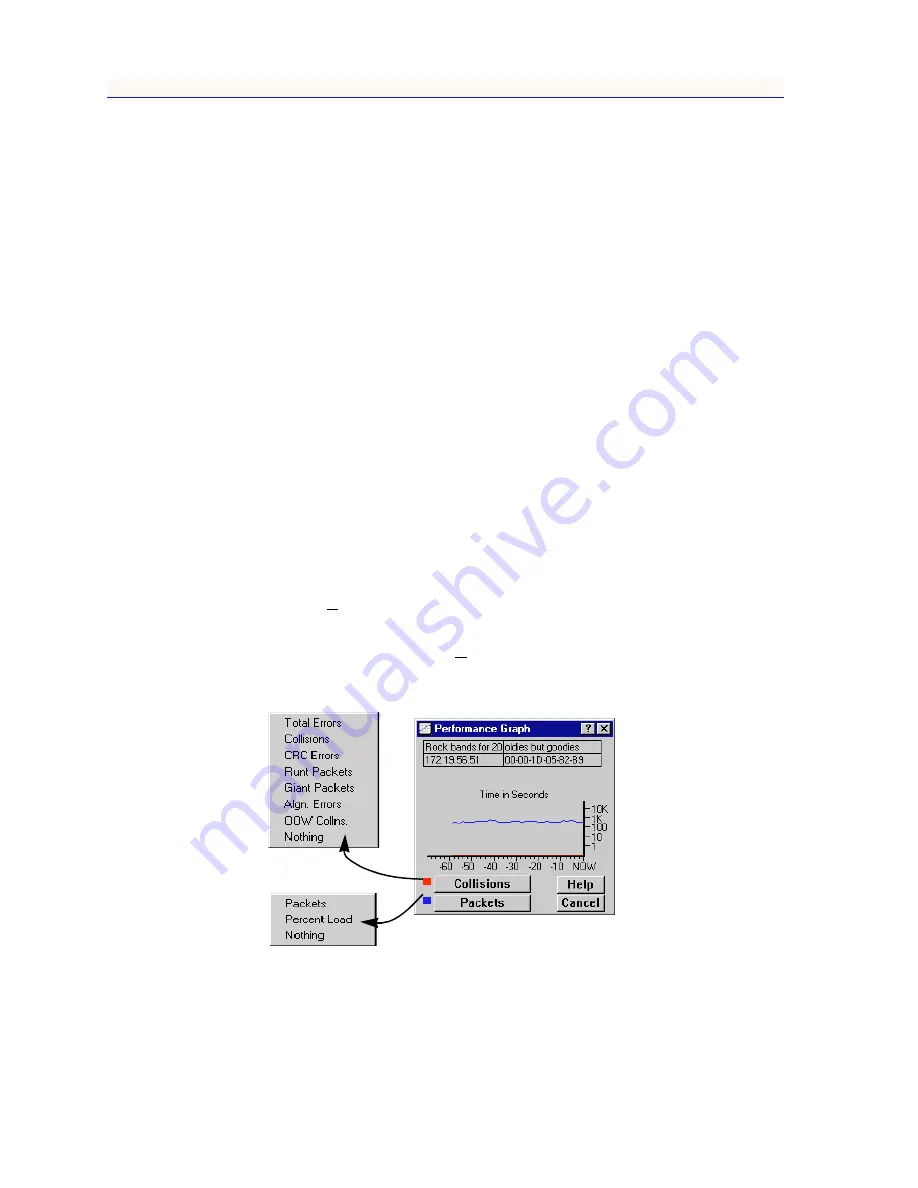
With the Repeater Performance Graphs, you can use real-time statistics reporting
to see at a glance the amount of traffic going through your IRM2 at the repeater,
board, or port level. The graph has an X axis that indicates the 60 second interval
over which charting occurs continuously, while the Y axis measures the number
of packets or errors that are processed by the device as a whole or by the selected
board, or port.
You can select the statistics that you wish to monitor by clicking the buttons at the
lower left of the Performance Graph window. When clicked, each button displays
a list of options; when you alter a parameter, the new parameter will appear on
the face of the button, and the statistics will refresh to zero activity before
regenerating.
Accessing the Performance Graph Windows
To access the Repeater Performance Graph window:
1.
Click on Repeater on the Chassis View menu bar to display the repeater
menu.
2.
Drag down to Performance Graph... and release. The Repeater Performance
Graphs window,
Figure 3-6
, will appear.
Figure 3-6. Performance Graph
Summary of Contents for IRM2
Page 1: ...IRM2 User s Guide...
Page 2: ......
Page 6: ...iv...
Page 10: ...Contents viii...
Page 18: ...Introduction 1 8 Getting Help...
Page 88: ...Index Index 4...


