e) The
Complex Sequences
mode mode allows the design of complex pulse sequences. Multiple sequences can
be combined to create a more elaborate pulse sequence. These are displayed in a spreadsheet format.
i. The
Starting Delay
(Fig.
) sets the delay (in hh:mm:ss:zzz format) before the first pulse sequence.
ii. The
Max Current
(Fig.
) sets the maximum current (in mA) for the given sequence.
iii. The
Number of sequences
(Fig.
) sets the number of times that the sequence will be repeated, with a
minimum of 1.
iv. The
Pulses per sequence
(Fig.
) sets the number of pulses per sequence, with a minimum of 1.
v. The
Delay between sequences
(Fig.
) sets the delay (in hh:mm:ss:zzz format) between each sequence
if the
Number of Sequences
is greater than 1.
vi. The
Frequency/Period
(Fig.
) sets the frequency (in Hz) or period (in ms) for the pulse sequence.
These two values are linked, and when one is changed the other will adjust automatically. For example,
a signal at 10 Hz (frequency) will output one pulse every 100 ms (period), whereas a pulse sequence at
0.5 Hz (frequency) will output one pulse every 2000 ms (period).
vii. The
Time ON/Duty Cycle
(Fig.
) sets the time (in ms) or the duty cycle (in %) for each pulse. These
two values are linked, and when one is changed the other will adjust automatically. The
Time ON
must
be lower than (1/fre0.005 ms, while the
Duty cycle
must be below 100 %.
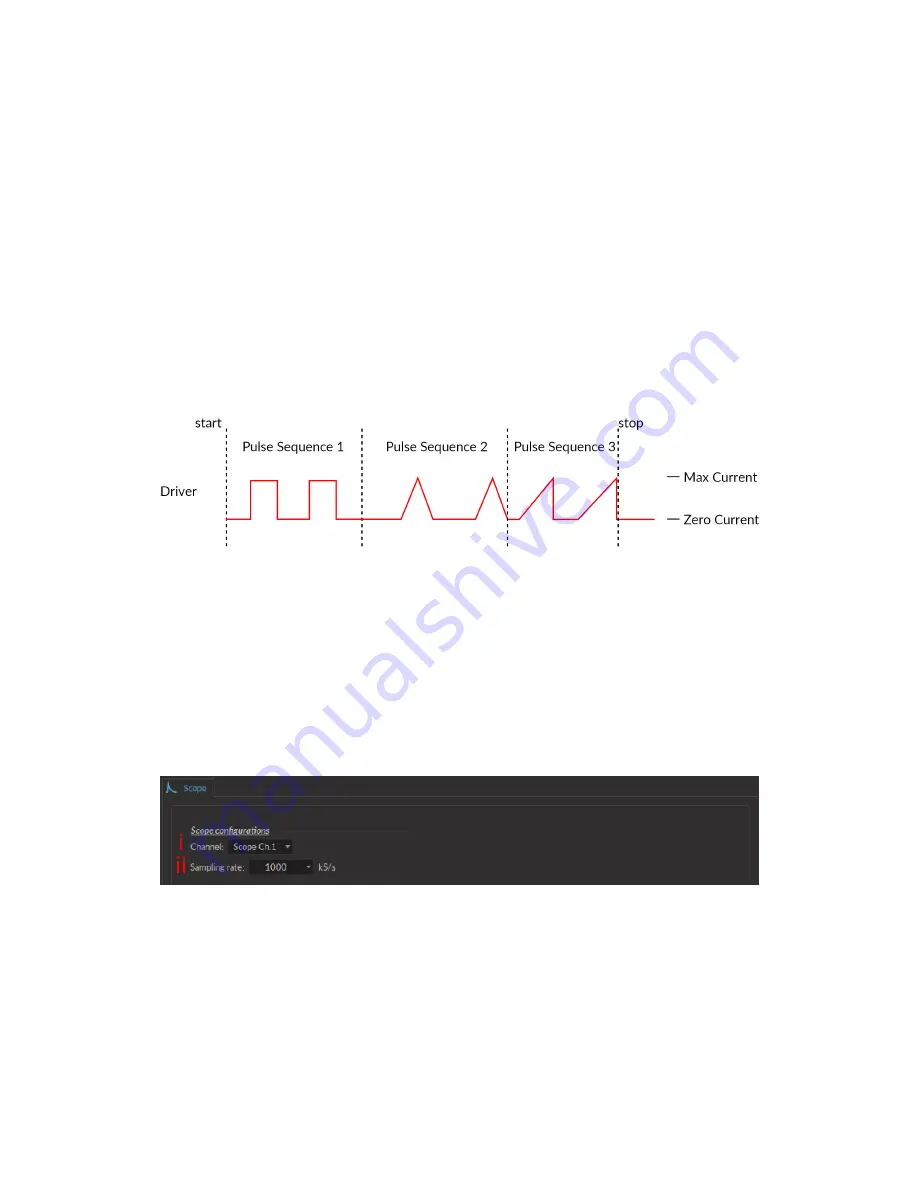
Figure 3.9:
Internal Complex Mode Pulse Sequences
viii. The
Types of pulses
(Fig.
) sets the pulse type. Pulses can be
Square
, triangular (
Triangle
),
Ramp
up Ramp down
or
Delay
(Fig.
). The
Delay
pulse type is used to create a delay between different
sequence
ix. The
Sequence controls
(Fig.
) allow the addition (
+
) or removal (
-
) of sequences to the spreadsheet.
x. The
Total Duration
(Fig.
) displays the total time of the experiment. The different values can be
Inf
for infinite, a valid time value or
Err
if the
Time ON
value is greater than 1/frequency.
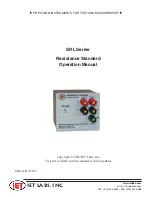
f) The
Scope
mode allows the measurement of electrical signal using the driver (Fig.
). The signal is received
by the Input BNC of the chosen channel on the light source driver.
Figure 3.10:
Scope
i. The
Channel
drop-down list indicated which driver channel will be used to receive signal. The chosen
can be used to drive a light source while serving as a scope.
ii. The
Sampling Rate
drop-down list allows the selection of the rate (in kilosamples per second) at which
measurements are taken.
4. The
Preview
box (Fig.
) displays a preview of the chosen sequence while in the
Continuous Wave
,
Square
Sequences
and
Complex Sequences
mode.
5. The
Apply
button (Fig.
) will generate the defined channel OR update an already configured channel with any
changes.
Chapter 3. Doric Neuroscience Studio
15


