1. The
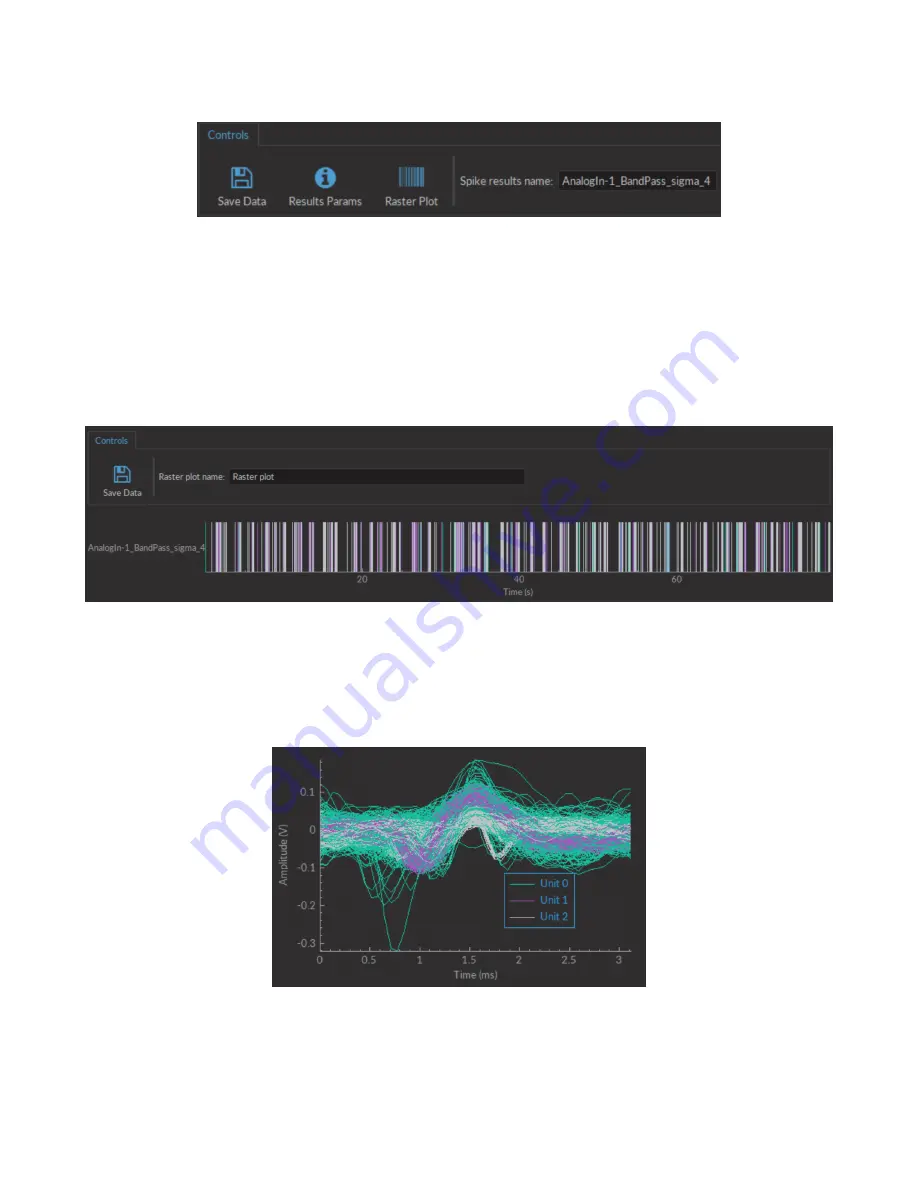
Control box
(Fig.
) displays options usable in the window.
Figure 3.37:
Spike Finder Control Box
• The
Save data
button records data in this window in the
.HDF5
format. The data can be added to a pre-
existing database.
• The
Results Params
button opens a window displaying the
Spike finder settings
. The settings cannot be
changed in this window.
• The
Raster Plot
button opens the
Raster plot window
(Fig.
). The window displays the raster plot of
all spikes over time, with each color corresponding to a single cluster. This window can be kept active over
multiple uses of the
Spike finder
, with all raster plots displayed within.
Figure 3.38:
Raster Plot Window
• The
Spike results name
shows the filename used to save the spike results.
2. The
Waveform box
(Fig.
) shows a superimposed view of all different spike waveforms recovered. Each dif-
ferent color corresponds to a different unit, as shown on the legend.
Figure 3.39:
Waveform box
3. The
Clusters
box shows a scatter plot of all spikes. Each color corresponds to a different unit.
Chapter 3. Doric Neuroscience Studio
36


