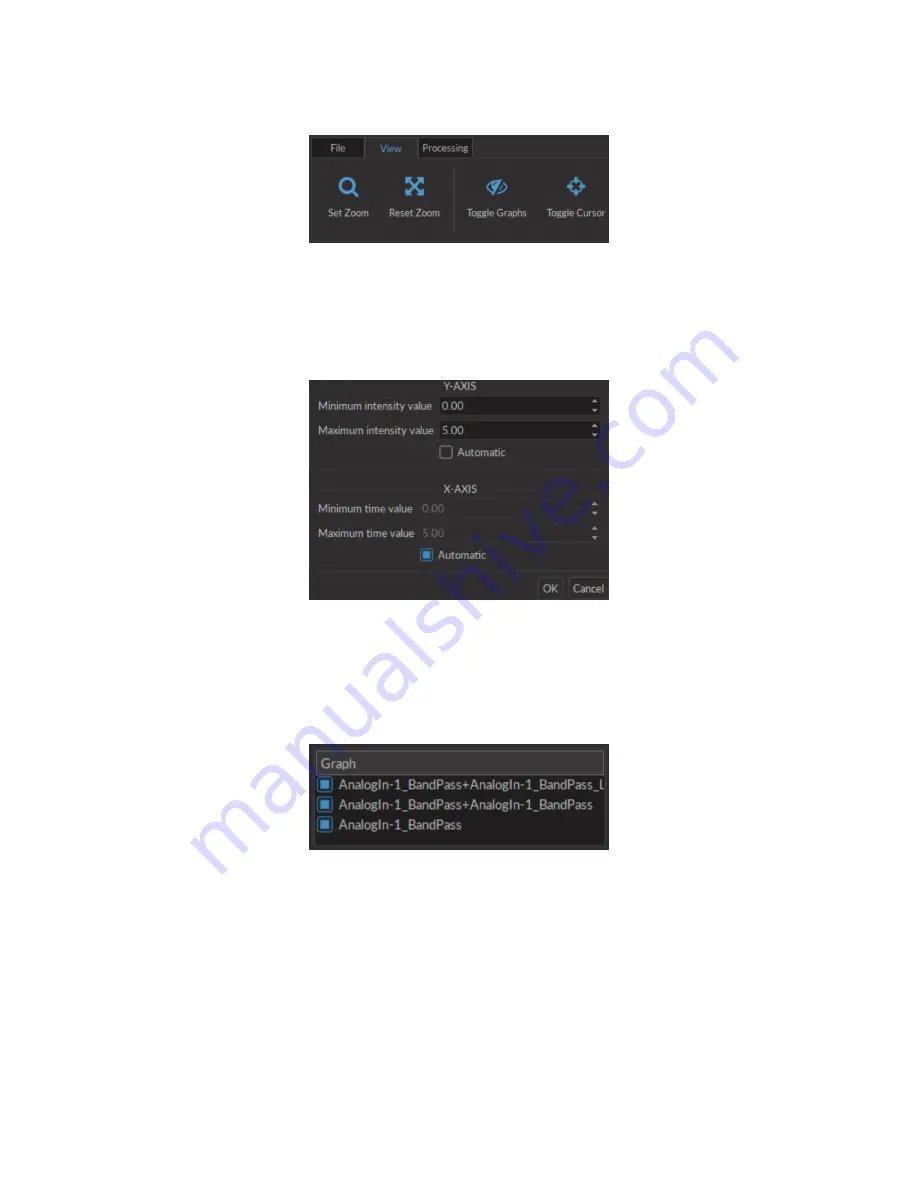
3.3.2 View
Figure 3.29:
View Tab
The
View
tab (Fig.
) is used to adjust the view in the
Graphs box
.
• The
Set Zoom
button opens the
Zoom window
(Fig.
). The minimum and maximum values of each axis can be
defined. The
Automatic
checkbox chooses axis values to fully display the entire data set.
Figure 3.30:
Set Zoom Window
• The
Reset zoom
button resets the axis values to those defined in
Set zoom
.
• The
Toggle graphs
button opens the
Show/hide graphs
window (Fig.
). Any checked data sets will be dis-
played in the
Graph box
.
Figure 3.31:
Show/hide Graphs Window
• The
Toggle cursor
button, when clicked, activates a red cursor in the
Graphs box
. This cursor can be moved to any
part of a graph by clicking the location, showing the coordinates of the chosen point. The cursor will be positioned
at the same temporal location on each graph.
3.3.3 Processing
The
Processing
tab (Fig.
) is used to process data sets loaded into the module.
Chapter 3. Doric Neuroscience Studio
33


