• The
Channel Name
(Fig.
) is indicated in the upper left.
• The
Trace # X
box (Fig.
) (where
X
is the number of the trace) show the visual options available for a
single trace on the graph. A trace box appears for each trace on the graph.
–
The
Trace Name
box contains a standard name generated by the software. The name can be changed
here.
–
The
Trace Color
button (
...
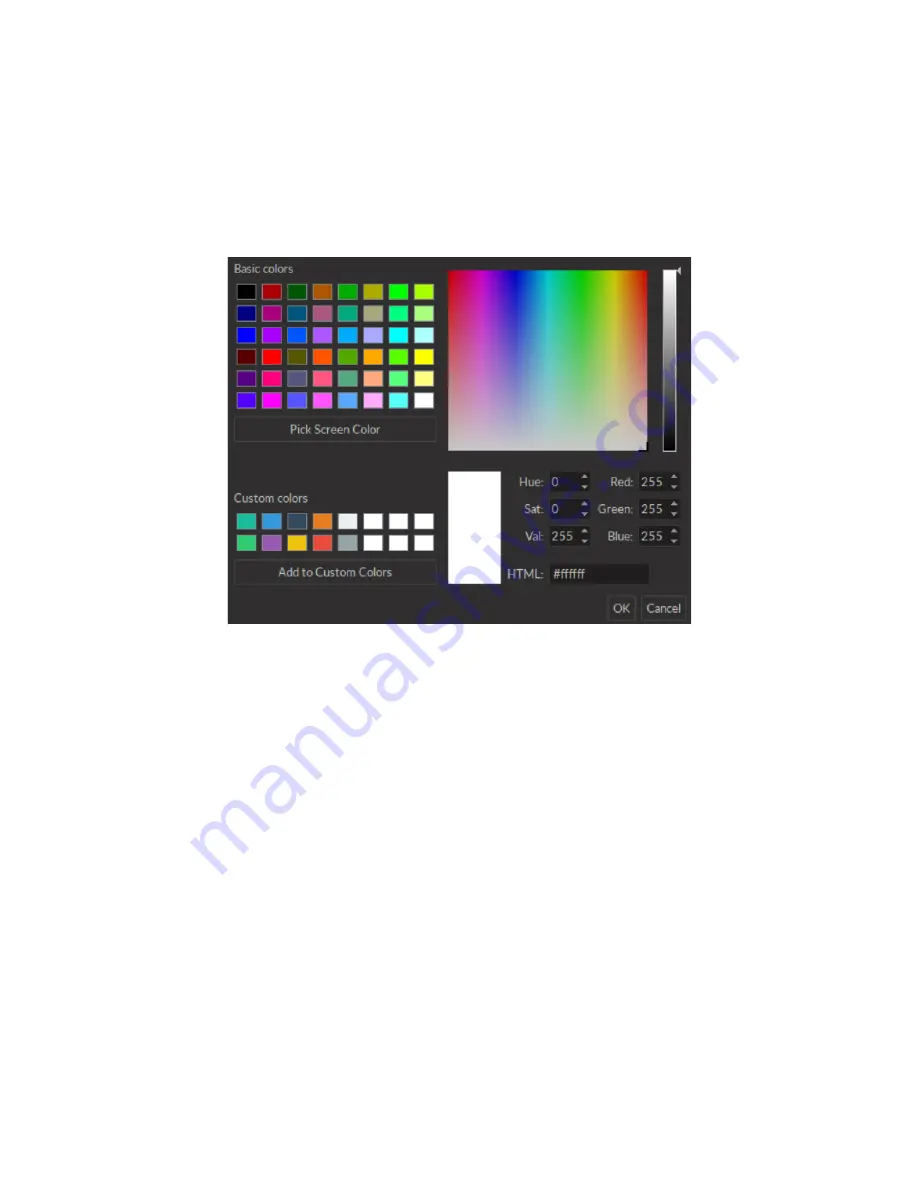
) opens the
Color Select
window (Fig.
), which allows the selection of a
trace color from a wide palette. The
Pick screen color
in this window allows the selection of any color
displayed on the computer screen.
Figure 3.26:
Select Color Window
–
The
Trace style
drop-down list allows the selection of the type of trace, from full to dashed lines. If the
style chosen is empty, the trace will not be displayed.
–
The
Trace size
drop-down list allows the selection of the trace size. Using a bigger
Trace size
than the
default may result in slower display nd performance degradation.
–
The
Type of points
drop-down list allows the selection of what type of point used to indicate data points
on the trace. Using different point types than the default (none) may result in slower display and perfor-
mance degradation.
4. The
Graph
(Fig.
) box displays the graph of a channel, with
Voltage
or
State
as the vertical axis and
Time
as
the horizontal axis. Double-clicking either axis will open a
Change Axis Range
window that allows the axis limits
to be changed, as in the
Zooming Menu
. Any changes done on a horizontal axis will change the axis limits for each
channel.
5. The
Instant values
box (Fig.
) can be activated by right-clicking the
Input graph
box and selecting
Show in-
stant values
. This box shows the current value detected by the console for each trace on the selected channel.
This box cannot be activated on
Preview graphs
.
6. The
Channel tabs
(Fig.
) appear in certain input modes (such as
Interleaved
and
Lock-in
) where the input
automatically sets the output values on separate channels. It is possible to create a
Channel tab
by undocking one
channel and moving it above another until it turns blue, then releasing it.
7. Analog output channels display an
Active state
graph (Fig.
). This graph displays whether the channel is out-
putting a signal (On, V
6
=
0) or not (Off, V=0).
8. Output channels display a
Preview
graph (Fig.
), showing a preview of the pulse sequence.
Chapter 3. Doric Neuroscience Studio
31


