background image

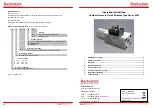
CHARACTERISTICS OF FIXED LOOPS

 Page 125

Impedance Graphs

-200

-150

-100

-50

0

50

100

150

200

250

0

200

400

600

800

1000

1200

1400

1600

Frequency, kHz

At CO Side

Real

Imaginary

-200

-150

-100

-50

0

50

100

150

200

250

0

200

400

600

800

1000

1200

1400

1600

Frequency, kHz

At Customer Side

Real

Imaginary

Summary of Contents for DLS 400A

Page 1: ...Revision 0 21 September 1999 TestW rks Operating Manual DLS 400A H N HN Wireline Simulator ...

Page 2: ......

Page 3: ... GPIB Card and Software Installation 9 3 10 1 Installing National Instruments GPIB Software IEEE 488 operation only 10 3 10 2 Installing the GPIB PCII IIA Card IEEE 488 operation only 10 3 10 3 How to Check if the NI card is installed properly 12 4 DLS 400 SOFTWARE 13 4 1 Overview 13 4 2 Software Installation 13 4 3 Initial Screen 13 4 3 1 Changing Communications Mode 14 4 4 Unit Configuration 15 ...

Page 4: ...I Proposed Working Draft for HDSL2 Standard T1E1 4 98 268 39 6 2 4 ADSL Rate Testing ANSI T1 413 Issue I and II 40 6 2 5 ADSL Rate Testing ITU Standard for G lite 40 6 2 6 Basic Rate Testing ETSI TS 102 080 ISDN Standard 40 6 2 7 HDSL Rate Testing ETSI TS 101 135 HDSL Standard 41 6 2 8 European ADSL rate testing ETSI ETR 328 ADSL Standard 41 6 3 Individual Impairments 41 6 4 Impairment Card Organi...

Page 5: ... 8 2 DLS 400 Synchronization 71 9 REMOTE CONTROL DEVICE DEPENDENT COMMANDS 73 9 1 Device Dependent Command Set for Loops 73 9 1 1 SETting CHANnel LOOP Loop Name 74 9 1 2 SETting CHANnel TAP_A NRf 77 9 1 3 SETting CHANnel LINE NRf 77 9 1 4 SETting CHANnel TAP_B NRf 78 9 1 5 SETting CHANnel DIRection FORward REVerse 79 9 1 6 SETting CHANnel BYpass NO YES 79 9 1 7 SETting PWRline LONGitudinal STate O...

Page 6: ... 7 Impulses 85 9 2 7 1 Impulses Type 85 9 2 7 2 Impulses Width 85 9 2 7 3 Impulses Level 85 9 2 7 4 Impulses Rate 85 9 2 7 5 Impulses Single Shot 86 9 2 8 Powerline Related Impairments 86 9 2 8 1 Metallic Noise Sine Wave Generators 86 9 2 8 1 1 Harmonic 1 Frequency 86 9 2 8 1 2 Harmonic 2 Frequency 86 9 2 8 3 Longitudinal Noise Triangle Wave Generator 87 9 2 9 Quiet 87 9 2 10 Output Stage 88 10 CH...

Page 7: ... 5 ANSI Loop 5 132 10 2 6 ANSI Loop 6 134 10 2 7 ANSI Loop 7 136 10 2 8 ANSI Loop 8 138 10 2 9 ANSI Loop 9 140 10 2 10 ANSI Loop 11 142 10 2 11 ANSI Loop 12 144 10 2 12 ANSI Loop 13 146 10 2 13 ANSI Loop 15 148 10 2 14 Mid ANSI Loop 7 150 10 3 EIA Loops 152 10 3 1 EIA Loop 1 152 10 3 2 EIA Loop 2 154 10 3 3 EIA Loop 3 156 10 3 4 EIA Loop 4 158 10 3 5 EIA Loop 5 160 11 CHARACTERISTICS OF IMPAIRMENT...

Page 8: ...Impulses 186 16 3 6 Powerline Related Metallic Noise 186 16 3 7 Longitudinal Noise 186 16 3 8 Externally Generated Signals 186 16 4 Mechanical 187 16 5 IEEE 488 Remote Control 187 16 6 RS 232 Remote Control 187 16 7 Included 188 16 8 Options 188 16 9 Electrical 188 16 9 1 AC Power 188 16 9 2 On Simulated Wireline 188 16 10 Environmental 189 16 11 Physical 189 16 12 Operating Conditions 189 17 SAFE...

Page 9: ... 2 2 Operating the Unit 192 17 3 Symbols 193 APPENDIX A INTERPRETATION OF LEVEL UNITS 195 APPENDIX B DLS 200 MODE 198 APPENDIX C MEASUREMENTS 199 C 1 Measurement of Wireline Simulators 199 C 2 Common Errors 200 APPENDIX D NOISE GENERATOR CONNECTIONS 201 APPENDIX E COMMONLY ASKED QUESTIONS 204 APPENDIX F PROGRAM EXAMPLE 206 F 1 Downloadable Crosstalk Noise 206 F 2 Captured Programming Commands 210 ...

Page 10: ...ations 42 Figure 6 4 Impairment Generators Block Diagram 47 Figure 6 5 Cook Pulse 51 Figure 6 6 ADSL Impulse c1 51 Figure 6 7 ADSL Impulse c2 52 Figure 6 8 ANSI Longitudinal Load Configuration 54 Figure 6 9 ETSI Longitudinal Load Configuration 54 Figure 11 1 T1 601 NEXT 162 Figure 11 2 DSL NEXT 162 Figure 11 3 HDSL NEXT 163 Figure 11 4 HDSL ADSL NEXT 163 Figure 11 5 T1 413 II EC ADSL upstream NEXT...

Page 11: ...11 18 T1 413 II T1 AMI NEXT ITU T NA T1 AMI NEXT HDSL2 T1 AMI NEXT 170 Figure 11 19 T1 413 II EC ADSL downstream NEXT 171 Figure 11 20 HDSL2 EC ADSL downstream NEXT 171 Figure 11 21 T1 413 II FDM ADSL downstream FEXT 9kft 26 AWG 172 Figure 11 22 ITU T NA FDM ADSL downstream NEXT HDSL2 FDM ADSL down stream NEXT T1 413 II FDM ADSL downstream NEXT 172 ...

Page 12: ......

Page 13: ...nsmission products but can be used to test many other digital transmission products as well The DLS 400 loop configurations address various testing requirements depending on the model chosen A H N or HN The DLS 400A offers all the ADSL test loops specified by ANSI T1 413 and a collection of other HDSL and ISDN test loops The DLS 400H offers all the loops necessary for testing to ANSI HDSL and HDSL...

Page 14: ...with a NIM card or a NSA 400 The DLS 400 is controlled by software running on any Windows 95 computer It includes both IEEE 488 and RS 232 interfaces for easy integration into a larger test sys tem 1 2 About this Manual Experienced users can refer to chapter 2 Quick Start to get their equipment up and run ning quickly First time users should read chapter 3 Getting Started thoroughly before powerin...

Page 15: ...the DLS 400 and switch the power on 2 Connect either the IEEE 488 or the RS 232 cable 3 Connect your Central Office equipment to side A of the DLS 400 4 Connect your Customer Site equipment to side B of the DLS 400 5 Start the software DLS NSA EXE Wireline Simulator Control Software 6 Select the desired loop and if applicable the length 7 Select the desired impairments 8 Begin testing ...

Page 16: ...es within 30 days DLS 400 Unit Power Cord 2 extra fuses RS 232C interconnnection cable IEEE 488 interconnection cable 2 CF to twin RJ 45 adaptors DL4 NSA Control Software DLS 400 LabView driver software 3 2 Hardware and Software Requirements To control the DLS 400 the following are required DLS 400 ADSL Wireline Simulator DLS 400 software package Windows 95 compatible computer with either National...

Page 17: ... STARTED Page 5 3 3 DLS 400 Front and Rear Panels Figure 3 1 DLS 400 Front Panel 1 Side A bantam jack 2 Side A balanced CF connector 3 Side B bantam jack 4 Side B balanced CF connector 5 Remote LED 6 Power LED ...

Page 18: ...EEE 488 Address DIP switch 5 Side A line input output bantam jack 6 Side A External Noise input BNC connector 7 RS 232 DCE serial connector 8 IEEE 488 connector 3 4 Digital Connections The DLS 400 works with both IEEE 488 and RS 232 interfaces Depending on your choice of interface do one of the following ...

Page 19: ...4 39mm The connector is also known under other names such as miniature telephone connector mini 310 connector bantam telco jack etc The CF connector is a balanced 3 pin ring tip ground connector It is possible to use banana plugs instead of the CF connector but note that the distance between the pins is not the 0 75 spacing used in North America Connect your Central Office equipment or equivalent ...

Page 20: ...t Exceptionally the power LED will turn blinking red if it fails its self test or yellow if it detects an inter nal error The REMOTE LED turns off after a power up and a reset When the DLS 400 receives the first remote message the REMOTE LED will then turn green If the DLS 400 detects an error in the message the REMOTE LED will then turn red and stay red until the error flags are cleared see the c...

Page 21: ...if the checksum of the EPROM is valid Checks if the non volatile RAM and its self contained battery are functional The battery has an expected life of over 10 years and if necessary it can be eas ily replaced Checks if the micro controller is functional After the self tests the DLS 400 re establishes the loop that was in use before the unit was turned off or reset but an impairments card if presen...

Page 22: ...egin and a GPIB Setting Options screen will appear Select the first option Install NI 488 2M Software for Windows 95 and follow the instructions to install the software 3 10 2 Installing the GPIB PCII IIA Card IEEE 488 operation only 1 From the Windows 95 Start Menu choose Settings Control Panel followed by Add New Hardware Click on the Next button to start the process At this point Windows will a...

Page 23: ...r installation by configuring it for GPIB PCII mode and 7210 mode the default setting 13 The manufacturer s default resource settings for GPIB PCII mode are Base I O Address 02B8 02BF Direct Memory Access DMA Channel 1 Interrupt Level IRQ 7 Compare the above settings with the settings you wrote down in step 9 If the set tings are different you must move the GPIB PCII IIA card s jumper and switches...

Page 24: ...rd is installed correctly by running the hardware diagnostic pro gram From the Windows 95 Start menu select Programs NI 488 2M Software for Windows Diagnostic Click on Test All If the diagnostic fails or can t find your GPIB card make sure that the settings on the card match those specified in the Device Manager If the diagnostic is successful click Exit to return to Windows 95 ...

Page 25: ... Software Installation To install the DLS 400 Control Software run SETUP EXE from D4 Series NSA 400 Control Software installation disk one and follow the instructions on the screen Note Operation with an IEEE 488 interface requires installation of a National Instru ments GPIB card and the associated GPIB software drivers before the installa tion of the DLS NSA software If you are using an RS 232 i...

Page 26: ...ote All edits changes made to loop and impairments settings in Offline mode will be lost when you exit the software However changes to the IEEE 488 address and impairments cards configuration will be saved 4 3 1 Changing Communications Mode To change the Communications Mode from the main control screen you must exit the program either by choosing Exit from the File menu or by clicking the close bo...

Page 27: ... the IEEE 488 address and the impairments cards for your unit go into Offline mode and from the main control screen select Unit Configura tion from the Options menu Figure 4 2 Main Control Screen This will bring up the system configuration screen Figure 4 3 System Configuration Screen ...

Page 28: ...ing the software so they need not be set each time 4 5 Main Control Screen The main control screen features a schematic diagram of the simulated loop Initially the diagram represents the bypass loop Use the scroll bar to see the available loops for your particular DLS 400 unit and select the loop you wish to test for The diagram will change to correspond to the selected loop Figure 4 4 Control Scr...

Page 29: ...ons for loading and saving impairments wireline settings and complete unit configurations i e both wireline settings and impairments You can also choose Load Impairments from Standard see section 4 5 1 1 The file extensions for the above file types are as follows File Type File Extension Complete Configuration D4 Side A Side B Impairments D4S Common Mode Impairments D4C Wireline Settings D4W ...

Page 30: ...g one of the impairments combina tions you must still select the loop s to be tested from the main control screen and you must also turn on the impairments card s in the Impairments Control Panel see section 4 6 Figure 4 5 Load Impairments Combination from Standards There are over 50 combinations of impairments available which allows setting the impair ment parameters to perform testing according ...

Page 31: ...Impairments Control Panel Clicking the Edit Impairments button in the main control screen opens the impairments control panel This allows you to apply and edit impairments to Sides A B and to start computer controlled impulses It also allows you to apply and edit Common Mode impair ments and to select the powerline frequency Figure 4 6 Impairments Control Panel The various settings are detailed in...

Page 32: ...irments Click on the Impulses button to start the computer con trolled impulse generation Common Mode impairments Check the On box to apply impairments to the line Click on edit to set the Common Mode impairments Note that Common Mode impairments cannot be applied when the line is set to 0 length Powerline Frequency Select between 50 Hz or 60 Hz Suggested Loops When impairments are loaded from a s...

Page 33: ...DLS 400 SOFTWARE Page 21 Figure 4 7 Editing Impairments Screen The various settings are detailed in the table on the following page ...

Page 34: ...rovides the shape name description the standard and the range According to which standard you are testing there are prefixes outlining the standards associated with the shape Level Set the level of the parameter Placing the cursor over this field brings up a callout which tells you the minimum and maximum values that you may enter This field will not allow you to set a value that is out of range F...

Page 35: ... 4 8 Edit Longitudinal Voltage This screen allows you to set the level of the longitudinal voltage within a minimum and maximum pre determined by the standard chosen It also allows you to select which side of the wireline A or B is the customer as opposed to CO side Name Description Calibration Impedance Shows the impedance used to calculate dBm power levels Note that when this value is changed th...

Page 36: ...g Two or More Units from the 400 Series Concurrently Two or more units from the 400 series DLS 400A DLS 400E and NSA 400 can be operated at the same time over the IEEE bus However each unit must be launched by its own session of the control software and each unit must have a unique IEEE address To create new sessions of the control software do the following 1 Create a new software folder for each ...

Page 37: ...ting ADSL transmissions up to 7 Mbit s The unit provides 28 standard test loops for testing ADSL and several others can be created by the user includ ing bridge tap settings on either or both sides In addition to the loops the DLS 400 also provides optional impairments generators which can be used for testing ISDN Basic Rate HDSL rate or ADSL rate transmission equipment to European or North Americ...

Page 38: ...ASS CSA 0 MID CSA 0 ANSI 2 CSA 1 MID CSA 1 ANSI 3 VARIABLE 24 AWG CSA 2 MID CSA 2 ANSI 4 VAR 24 AWG TAP CSA 4 MID CSA 3 ANSI 5 VARIABLE 26 AWG CSA 5 MID CSA 4 ANSI 6 VAR 26 AWG TAP CSA 6 MID CSA 5 ANSI 7 CSA 7 MID CSA 6 ANSI 8 CSA 8 ANSI 9 EXT CSA 9 ANSI 11 EXT CSA 10 ANSI 12 ANSI 13 ANSI 15 BYPASS CSA 1 CSA 2 VARIABLE 24 AWG CSA 3 VAR 24 AWG TAP CSA 4 VARIABLE 26 AWG CSA 5 VAR 26 AWG TAP CSA 6 CS...

Page 39: ...AP CSA 8 ANSI 7 EIA 4 VARIABLE 26 AWG MID CSA 6 ANSI 8 EIA 5 VAR 26 AWG TAP ANSI 9 ANSI 13 MID ANSI 7 BYPASS CSA 1 ANSI 1 EIA 1 CSA 2 ANSI 2 EIA 2 VARIABLE 24 AWG CSA 3 ANSI 5 EIA 3 VAR 24 AWG TAP CSA 4 ANSI 7 EIA 4 VARIABLE 26 AWG CSA 5 ANSI 8 EIA 5 VAR 26 AWG TAP CSA 6 ANSI 9 CSA 7 ANSI 13 CSA 8 MID ANSI 7 EXT CSA 9 EXT CSA 10 MID CSA 6 ...

Page 40: ...A Loops BYPASS CSA 0 CSA 1 CSA 2 CSA 3 A B A B 5 9 kft 26 1 8 kft 26 600 ft 26 A B 3 0 kft 26 700 ft 24 350 ft 24 3 0 kft 26 650 ft 26 700 ft 26 A B 2 2 kft 26 700 ft 26 1 5 kft 26 600 ft 24 3 05 kft 26 500 ft 26 50 ft 24 50 ft 24 50 ft 24 50 ft 26 100 ft 24 ...

Page 41: ...N Page 29 CSA 4 CSA 5 CSA 6 CSA 7 CSA 8 A B 550 ft 26 6 25 kft 26 800 ft 26 800 ft 26 400 ft 26 A B 5 8 kft 26 150 ft 24 1 2 kft 26 300 ft 26 300 ft 24 1 2 kft 26 A B 9 0 kft 26 A B 10 7 kft 24 800 ft 24 A B 12 0 kft 24 ...

Page 42: ...XT CSA 10 MID CSA 0 MID CSA 1 MID CSA 2 A B 9 0 kft 26 1 0 kft 24 500 ft 24 A B 7 5 kft 26 4 5 kft 24 500 ft 26 A B 6 0 kft 26 4 0 kft 26 A B 4 1 kft 24 1 1 kft 24 2 4 kft 26 100 ft 26 100 ft 26 A B 600 ft 26 4 7 kft 26 1 0 kft 26 200 ft 26 ...

Page 43: ...D CSA 4 MID CSA 5 MID CSA 6 5 3 2 ANSI Loops ANSI 1 A B 8 0 kft 24 A B 4 0 kft 26 1 1 kft 26 400 ft 24 400 ft 24 400 ft 24 A B 500 ft 26 900 ft 26 400 ft 24 2 4 kft 26 100 ft 22 1 5 kft 26 500 ft 26 A B 6 0 kft 26 A B 1 5 kft 24 16 5 kft 26 ...

Page 44: ... 3 ANSI 4 ANSI 5 A B 13 5 kft 26 3 0 kft 24 1 5 kft 24 A B 7 5 kft 26 6 0 kft 24 1 5 kft 24 1 0 kft 22 1 0 kft 22 1 5 kft 24 500 ft 24 1 0 kft 24 500 ft 24 A B 7 5 kft 26 4 5 kft 24 2 0 kft 22 3 0 kft 26 A B 9 0 kft 26 6 0 kft 24 1 5 kft 26 ...

Page 45: ... ANSI 8 ANSI 9 ANSI 11 A B 4 5 kft 26 12 0 kft 24 1 0 kft 24 500 ft 22 500 ft 24 A B 13 5 kft 26 A B 9 0 kft 24 1 0 kft 22 6 0 kft 26 1 0 kft 24 A B 3 0 kft 26 6 0 kft 26 1 5 kft 26 1 5 kft 26 1 5 kft 26 1 5 kft 26 A B 12 0 kft 26 1 5 kft 26 ...

Page 46: ...N Page 34 ANSI 12 ANSI 13 ANSI 15 Mid ANSI 7 5 3 3 EIA Loops EIA 1 A B 7 5 kft 26 4 5 kft 24 1 5 kft 26 A B 9 0 kft 26 2 0 kft 24 500 ft 24 500 ft 24 1 5 kft 26 1 5 kft 26 12 0 kft 26 A B A B 11 0 kft 26 A B 2 0 kft 26 ...

Page 47: ...TION Page 35 EIA 2 EIA 3 EIA 4 EIA 5 5 3 4 Variable Loops Variable 24 AWG A B 4 0 kft 26 3 0 kft 24 A B 7 0 kft 26 1 5 kft 26 12 0 kft 26 A B A B 9 0 kft 26 6 0 kft 24 1 5 kft 26 0 15 0 kft 24 DLS 400A 0 18 0 kft A B ...

Page 48: ...s to terminals A and B within the DLS 400 but leave the make up of the loop unchanged For example if you set CSA loop 2 with impairments on slot A you would get this loop A B 0 12 0 kft 24 0 1 5 kft 24 0 1 5 kft 24 B 0 18 0 kft 26 DLS 400A 0 15 0 kft A A B 0 15 0 kft 26 DLS 400A 0 12 0 kft 0 1 5 kft 26 0 1 5 kft 26 A B 3 0 kft 26 700 ft 24 350 ft 24 3 0 kft 26 650 ft 26 700 ft 26 Impairments Gener...

Page 49: ... side B noise can be injected on either side of the loop by selecting the appropriate noise card without the need to move a single noise card nor to reconnect the ATU C and ATU R equipment Note When a loop is reversed the main control screen will not show a reversed dia gram of the loop Rather it will show the loop with the terminal positions A and B reversed and highlighted in magenta That is the...

Page 50: ... 1 ADSL card that card is connected to the transformer and is used to supply the longitudinal noise You must indicate the impairment cards loaded by selecting Unit Configuration from the Options menu of the Control Screen Figure 6 1 System Configuration Screen 6 2 Grouped Impairments Most impairments generated are specified by ANSI s T1E1 committee setting standards for ISDN Basic Rate HDSL rate a...

Page 51: ...ide B 60 Hz option 50 Hz Power related Metallic Noise Odd harmonics of the fundamental up to 11th harmonic Crosstalk Noise NEXT Spectrum and level as specified by ANSI for basic rate DSL 2B1Q transmission Impairment Description Crosstalk Noise NEXT Spectrum and level as specified by ANSI for HDSL rate DSL 2B1Q transmission Power related Metallic Noise Odd harmonics of the fundamental up to 11th ha...

Page 52: ...n combination There are 3 different and independent crosstalk generators The output level of each one is variable They can be mixed together to form a wide variety of crosstalk combinations Impairment Description Crosstalk Noise NEXT Spectrum and level as specified by ANSI for ADSL G lite rate transmission Impairment Description Shaped Noise Multiple tones at 160 Hz and harmonics up to 300 kHz amp...

Page 53: ...ws 1 In the main control screen select File Load Impairments from Standard 2 Select All impairments combination Impairment Description Shaped Noise Multiple tones at 320 Hz and harmonics up to 1 5 MHz amplitude and phase related as specified Impulse Test The Cook pulse of selectable rate and level Longitudinal Noise Common mode at 50 Hz 60 Hz option at up to 20 Volts Impairment Description Impulse...

Page 54: ...ADSL NOISE GENERATOR DESCRIPTION Page 42 Figure 6 2 Loading all impairments Figure 6 3 Impairments combinations ...

Page 55: ... 11 13 ADSL A Crosstalk 85 to 35 dBm For spectrum see Figure 11 14 ADSL B Crosstalk 85 to 35 dBm For spectrum see Figure 11 15 T1 Crosstalk 85 to 35 dBm For spectrum see Figure 11 16 E1 AMI Crosstalk 85 to 35 dBm For spectrum see Figure 11 17 ADSL upstream NEXT T1 413 Issue I and II Crosstalk 30 to 80 dBm For spectrum see Figure 11 5 ADSL upstream FEXT 9 kft 26 AWG Crosstalk 30 to 80 dBm For spect...

Page 56: ... dBm For spectrum see Figure 11 21 FDM ADSL down stream NEXT Crosstalk 17 to 67 dBm For spectrum see Figure 11 22 EURO K Crosstalk 20 to 70 dBm For spectrum see Figure 11 12 ETSI BASIC Shaped 3 2 to 100 µV Hz ETSI Basic Rate Shaped Noise ETSI HDSL Shaped 3 2 to 100 µV Hz ETSI HDSL Rate Shaped Noise FTZ 1TR 200 Shaped 3 2 to 100 µV Hz Basic Rate Shaped Noise to FTZ specs Metallic 1 Offset 10 dB Any...

Page 57: ... Name Type Level Range Description Rate Width Cook Pulse Impulse 20 to 6 dB Used for HDSL rate testing See Figure 6 5 0 100 pps or single shot n a ADSL 1 c1 Impulse 0 100 mV Used for ADSL rate testing See Figure 6 6 0 100 pps or single shot n a ADSL 2 c2 Impulse 0 100 mV Used for ADSL rate testing See Figure 6 7 0 100 pps or single shot n a Bipolar Impulse 0 100 mV 0 100 pps or single shot 20 120 ...

Page 58: ... several generators that can simulate various impairments These generators can all generate signals simultaneously although each individual gener ator can produce only one impairment at a time The signals generated are added together in the summing amplifier Some generators such as Crosstalk A can generate several choices of crosstalk but not simultaneously The following block diagram shows these ...

Page 59: ...pedance is high the noise generator acts as a current source For any impairments except longitudinal noise the level seen on the line depends on the line impedance External Input Attenuated by 20 dB Shaped Noise Metallic Noise Low level sinewave set to an odd power line frequency Low Frequency Crosstalk Noise XtalkA Low Frequency Crosstalk Noise XtalkB Impulses 3 level bipolar unipolar and complex...

Page 60: ... generator A Reference levels of noise with dBm based on 100 Ω are as follows Type Level dB T1 601 45 0 10 disturber DSL NEXT 56 1 10 disturber HDSL NEXT 47 6 10 disturber ADSL NEXT 49 9 10 disturber HDSL ADSL 45 6 49 disturber ADSL upstream NEXT ANSI T1 413 Issue I and II 43 3 49 disturber ADSL upstream FEXT 9kft 26AWG 69 1 49 disturber ADSL upstream NEXT ITU G Lite 43 3 49 disturber FDM ADSL dow...

Page 61: ...nterferers is as given above in section 6 6 Number of disturbers Level difference dB relative to 10 disturber Level difference dB relative to 49 disturber 49 4 1 0 0 24 2 3 1 8 20 1 8 2 3 10 0 0 4 1 4 2 4 6 5 1 6 0 10 1 Type Level dB 10 disturber ADSL FEXT 69 6 ADSLA 49 4 ADSLB 43 0 10 disturber T1 NEXT 47 8 10 disturber AMI 46 0 49 disturber T1 AMI NEXT 43 7 49 disturber EC ADSL downstream NEXT 2...

Page 62: ... 3 dB point located at 2 MHz 6 10 Impulse Generator Seven different types of impulses may be selected They are 3 level bipolar unipolar unipolar Cook ADSL c1 ADSL c2 3 level bipolar unipolar and unipolar impulses consist of only 2 or 3 different levels These types of impulses are calibrated in mV peak to peak The pulse width variable from 20 to 120 micro seconds is only enabled when one of these t...

Page 63: ...ADSL NOISE GENERATOR DESCRIPTION Page 51 Figure 6 5 Cook Pulse Figure 6 6 ADSL Impulse c1 ...

Page 64: ... be reduced by approximately 30 dB Also the source output must be turned on for the external noise to be applied 6 12 Powerline Related Impairments Two types of impairments due to the interference from AC power lines are generated by the ADSL noise card One of them is called metallic and the other one longitudinal The reference powerline frequency used in both cases can be selected as 50 or 60 Hz ...

Page 65: ...able 6 12 2 Longitudinal Noise Longitudinal noise is a triangular waveform which is injected in common mode on the wireline using a transformer Associated with the longitudinal noise some longitudinal loads should also be used The ETSI TS 102 080 ISDN Standard formerly ETR80 requires that both pairs of loads located on both sides of the transformer are set any time the longitudinal voltage is gene...

Page 66: ...ngitudinal Load Configuration If both loads are installed equal and opposite phase voltages appear at the end of the lines They are half the voltage that appears at one end of the line if only one load is in place Figure 6 9 ETSI Longitudinal Load Configuration ...

Page 67: ...essing 0 Volts of longitudinal mode voltage on the line and running a test like this Then you can run with longitudinal voltage as well to determine additional degradation due to the longitudinal voltage 6 12 3 DLS 200 Mode Crosstalk and White Noise All 3 crosstalk generators and the white noise generator are based on noise produced by Pseudo Random Binary Sequences This base noise is then used to...

Page 68: ...0 The serial port physical interface follows the EIA RS 232 standard The IEEE 488 and the serial interfaces are always enabled and can be used alternatively The DLS 400 directs its output to the last interface from which it received data Both inter faces use the same command set and produce the same results Section 7 1 describes fea tures specific to the IEEE 488 interface section 7 2 describes fe...

Page 69: ...uest SRQ Line The SRQ line as defined by the IEEE 488 1 standard is raised when the DLS 400 is requesting service Here are some examples of services that could raise SRQ a message is available in the output buffer an error occurred all pending operations are completed the power was just turned on In order to use the SRQ line all relevant enable bits must be set For example the SRQ line can be rais...

Page 70: ... interface when IFC is received In the RESET position pin 2 and 3 IFC resets the entire unit The factory default is to set JP2 in the IFC position pin 1 and 2 7 1 4 Message Terminators Messages to the DLS 400 must be terminated with either a Line Feed character ASCII LF decimal 10 hex 0A an IEEE 488 1 EOI signal or both Messages from the DLS 400 are always terminated with a Line Feed character and...

Page 71: ...get the identification message with the IEEE 488 interface do the follow ing 1 transmit SRE 48 enable MAV and ESB needed only once 2 transmit ESE 60 enable all the error bits needed only once 3 transmit IDN query the identification message 4 wait for SRQ to be raised 5 read the status byte use the IEEE 488 1 serial poll command not STB 6 if MAV bit 4 is set read the response 7 if ESB bit 5 is set ...

Page 72: ...ned by the RS 232 standard If desired the user can leave the RTS line set and use only the CTS line 7 2 1 Message Terminators Messages sent to the DLS 400 through the serial interface MUST be terminated with the line feed character decimal 10 hex 0A LF To ensure that no characters are left in the receive buffer of the DLS 400 from a previous incomplete command you can send the line feed character ...

Page 73: ...he identification message with the RS 232 interface do the follow ing 1 transmit ESE 60 enable all the error bits needed only once 2 transmit IDN query the identification message 3 read the answer the messages are always terminated with LF 4 transmit ESR check if an error occurred 5 read the answer if not 0 see section 8 1 for description of the error s 7 3 Data formats The DLS 400 adheres to the ...

Page 74: ... the decimal part of a number 7 4 Command Syntax The DLS 400 adheres to the IEEE 488 2 format for command syntax As with the Data Format the principle is forgiving listening and precise talking Commands may take one of two forms either a Common Commmand or a Device Dependent Command The format of each is detailed in subsequent chapters chapters 8 and 9 respectively Each type may be preceded by one...

Page 75: ...tem follow the same format as the commands except that the data nor mally associated with a command is replaced by a question mark Following receipt of such a command the DLS 400 will place the appropriate response in the output queue where it can be read by the controller Examples are IDN ESE SRE SET CHAN LOOP When a command does not begin with a colon the DLS 400 assumes that the command is at t...

Page 76: ...tput queue bit 4 of the STB ESE NRf Event Status Enable Type Status command Function Sets the Event Status Enable Register ESER using an integer value from 0 to 255 representing a sum of the bits in the following bit map Bits 7 to 0 have values of 128 64 32 16 8 4 2 and 1 respectively For example if bits 3 and 5 are set then the integer value is 40 8 32 The ESER masks which bits will be enabled in...

Page 77: ...he possible values are described in the ESE command section and in more detail in sec tion 9 1 IDN Identification Query Type System command Function Returns the ID of the unit Upon receiving this command the DLS 400 will put the following string into the output queue CONSULTRONICS LTD DLS 400 SN Ver where SN is the serial number of the unit Ver is the revision level of the control firmware always ...

Page 78: ...a ble registers are restored from the non volatile RAM at power on The factory default is 1 clear all the enable registers Any change to the Power on Status is saved in non volatile RAM and is always restored on power up PSC Power on Status Clear Query Type Status and event command Function Return the Power on Status Clear value If 1 then all the enable regis ters are cleared at power on if 0 then...

Page 79: ...if the bit is 0 see PSC for more details SRE Service Request Enable Query Type Status command Function An integer value representing the value of the Service Request Enable Register is placed in the output queue The possible values are listed in the SRE command section STB Status Byte Query Type Status command Function The value of the Status Byte Register is put into the output queue Con trary to...

Page 80: ...d Function Returns the results of the self test done at power up The number returned has the following bit map Bits 7 to 0 have values of 128 64 32 16 8 4 2 and 1 respectively For example if bits 3 and 5 are set then the integer value is 40 8 32 MAV Message Available bit ESB Event Status bit MSS Master Summary Status bit not used should always be 0 not used should always be 0 Bit 7654 3210 0 passe...

Page 81: ...er STB and the Event Status Register ESR For both registers there are three basic commands one to read the register one to set the enabling bits and one to read the enabling bits Where NRf is the new value of the register 8 1 1 Status Byte Register STB The bits of this register are mapped as follows bit 4 MAV Message Available Bit Indicates that the Output Queue is not empty If MAV goes high and i...

Page 82: ...atus Register ESR The Event Status Register monitors events within the system and reports on those enabled It records transitory events as well The DLS 400 implements only the IEEE 488 2 Stand ard Event Status Register ESR It is defined as bit 0 Operation Complete This bit is set in response to the OPC command when the current operation is complete bit 1 Request Control The DLS 400 does not have t...

Page 83: ...d with the Event Status Register query command ESR This will put the value of the register in the output queue AND will clear the register 8 2 DLS 400 Synchronization The program controlling the DLS 400 can use three different commands to synchronize with the DLS 400 OPC OPC and WAI Following are the main differences 1 if Operation Complete and ESB are enabled 2 if MAV is enabled The main differen...

Page 84: ...e program controlling the DLS 400 can determine when the operation is completed by waiting for SRQ or by reading the status byte with the serial poll or with STB if corresponding bits are enabled If the program uses the OPC command and then sends more queries the program must be ready to receive the 1 concatenated to other responses at any time When using WAI the communication time out should be s...

Page 85: ...ure SETting CHANnel LOOP Loop Name TAP_A NRf LINE NRf TAP_B NRf DIRection FORward REVerse BYPASS NO YES SETting PWRline LONGitudinal STate OFF ON Each section of the command may be sent in the full or the truncated form indicated in upper case The command itself may be sent in upper or lower case form The DLS 400 will round any number to the nearest number permitted by the resolution of the parame...

Page 86: ...an be any of the loops available to your specific unit as follows DLS 400A BYPASS CSA_ 0 MID CSA_ 0 ANSI_ 2 CSA_ 1 MID CSA_ 1 ANSI_ 3 VARIABLE_24_AWG CSA_ 2 MID CSA_ 2 ANSI_ 4 VAR_24_AWG TAP CSA_ 4 MID CSA_ 3 ANSI_ 5 VARIABLE_26_AWG CSA_ 5 MID CSA_ 4 ANSI_ 6 VAR_26_AWG TAP CSA_ 6 MID CSA_ 5 ANSI_ 7 CSA_ 7 MID CSA_ 6 ANSI_ 8 CSA_ 8 ANSI_ 9 EXT CSA_ 9 ANSI_ 11 EXT CSA_ 10 ANSI_ 12 ANSI_ 13 ANSI_ 15 ...

Page 87: ...AR_24_AWG TAP CSA_ 4 VARIABLE_26_AWG CSA_ 5 VAR_26_AWG TAP CSA_ 6 CSA_ 7 CSA_ 8 EXT CSA_ 9 EXT CSA_ 10 BYPASS CSA_ 4 ANSI_ 1 EIA_ 1 CSA_ 6 ANSI_ 2 EIA_ 2 VARIABLE_24_AWG CSA_ 7 ANSI_ 5 EIA_ 3 VAR_24_AWG TAP CSA_ 8 ANSI_ 7 EIA_ 4 VARIABLE_26_AWG MID CSA_ 6 ANSI_ 8 EIA_ 5 VAR_26_AWG TAP ANSI_ 9 ANSI_ 13 MID ANSI_ 7 ...

Page 88: ...atible ANSI loop number 2 send SET CHAN LOOP ANSI_ 2D2 To query the loop currently simulated by the DLS 400 send SET CHAN LOOP The command will return the simulated loop For example if the selected loop is ANSI 4 the returned message will be ANSI_ 4 BYPASS CSA_ 1 ANSI_ 1 EIA_ 1 CSA_ 2 ANSI_ 2 EIA_ 2 VARIABLE_24_AWG CSA_ 3 ANSI_ 5 EIA_ 3 VAR_24_AWG TAP CSA_ 4 ANSI_ 7 EIA_ 4 VARIABLE_26_AWG CSA_ 5 A...

Page 89: ...the DLS 400 see section 7 3 To query the length currently simulated by the DLS 400 send SET CHAN TAP_A The command will return an integer number ranging from 0 to 1500 followed by the units For example if the length is 1 5 kft the returned message will be 1500 FT 9 1 3 SETting CHANnel LINE NRf This command selects the length of the line where NRf is the length ranging from 0 up to the maximum show...

Page 90: ...r example if the length is 1 5 kft the returned message will be 1500 FT 9 1 4 SETting CHANnel TAP_B NRf This command selects the length of the tap on side B where NRf is the length ranging from 0 to 1500 ft in steps of 500 ft For example to set the length to 1 5 kft send SET CHAN TAP_B 1 5 kft The units of the length are optional but they must be ft if present For more details on the numeric forma...

Page 91: ...eline send SET CHAN DIR The command will return either FORWARD or REVERSE See section 5 3 5 for an example of this feature 9 1 6 SETting CHANnel BYpass NO YES This command controls the bypass of the wireline cards For example to bypass the wire line cards send SET CHAN BY YES To query the current setting of the bypass send SET CHAN BY 9 1 7 SETting PWRline LONGitudinal STate OFF ON This command co...

Page 92: ... in slot A and sourceB for the other slot The rest of the command can be summarized like this sourceA xtalkA type choice level numeric value dBm xtalkB type choice level numeric value dBm xtalkC type choice level numeric value dBm shaped type choice level numeric value µV Hz level numeric value dBm Hz level numeric value dBm white level numeric value dBm Hz impulse type choice width numeric value ...

Page 93: ...rator A Type source xtalkA type choice Range OFF T1 601 DSLNEXT HDSL HDSL ADSL 9 2 2 2 Xtalk Generator A Level source xtalkA level numeric value dBm Range 75 0 to 30 0 dBm in 0 1 dB steps 9 2 2 3 Xtalk Generator A Program sourceA xtalkA Program Data Start tells the system to start a new data set Name must be in quotes and is a maximum of 16 characters Type will by default be external unless a name...

Page 94: ...eric value dBm Range 75 0 to 30 0 dBm in 0 1 dB steps 9 2 3 3 Xtalk Generator B Program sourceA xtalkB Program Data Start tells the system to start a new data set Name must be in quotes and is a maximum of 16 characters Type will by default be external unless a name is programmed Minimum and Maximum as per your level range 9 2 4 Crosstalk Generator C 9 2 4 1 Xtalk Generator C Type source xtalkC ty...

Page 95: ...are different The 10 tone noise must be set 36 2 dB less than the model A noise So to set model A noise to 55 4 dBm you should send source xtalkC type ADSLA source xtalkC level 55 4 dBm source shaped type 10 tone source shaped level 91 6 dBm 9 2 4 3 Xtalk Generator C Program sourceA xtalkC Program Data Start tells the system to start a new data set Name must be in quotes and is a maximum of 16 cha...

Page 96: ...ally in dBm when the type selected is 10 tone and is usually set to 70 0 dBm Note that the units are NOT optional when setting the level in dBm Hz or in dBm 9 2 5 3 Shaped Noise Generator Program sourceA Shaped Program Data Start tells the system to start a new data set Name must be in quotes and is a maximum of 16 characters Type will by default be external unless a name is programmed Size 9 2 6 ...

Page 97: ...n 1µs steps Only applies to 3 level bipolar and unipolar impulses 9 2 7 3 Impulses Level source impulse level numeric value mV Range 0 0 to 100 0 mV peak in 0 1 mV steps This syntax must be used only for non complex impulses or source impulse level numeric value dB Range 20 0 to 6 0 dB in 0 1 dB steps This syntax must be used ONLY for complex pulses 9 2 7 4 Impulses Rate source impulse rate numeri...

Page 98: ...y source pwrline metallic harmonic1 choice Choice 0 to 6 where 0 off 1 fundamental 50 60 Hz 2 2nd odd harmonic 150 180 Hz 3 3rd odd harmonic 250 300 Hz 4 4th odd harmonic 350 420 Hz 5 5th odd harmonic 450 540 Hz 6 6th odd harmonic 550 660 Hz 9 2 8 1 2 Harmonic 2 Frequency source pwrline metallic harmonic2 choice Range 0 to 6 Note that the second frequency is disabled if both frequencies are equal ...

Page 99: ...he longitudinal voltage is generated For ANSI standards only ONE load should be inserted Longitudinal Loads source load1 boolean Range OFF ON source load2 boolean Range OFF ON Also associated with the longitudinal impairment is the command which sets the second aries of the longitudinal transformer in or out of circuit See section 6 5 6 9 2 9 Quiet This command turns off all impairments but leaves...

Page 100: ...pe OFF level 3 2 µV Hz xtalkA type OFF level 75 0 dBm xtalkB type OFF level 75 0 dBm xtalkC type OFF level 85 0 dBm white level 140 0 dBm Hz state off load1 OFF load2 OFF 9 2 10 Output Stage Connects or disconnects the impairments generator to or from the line source output boolean Range OFF ON ...

Page 101: ... any practical applica tions The following graphs characterize 28 of the 29 standard loops within the DLS 400 We have not characterized the Bypass loop We have not attempted to provide curves for the variable loops since there are far too many of them Each page shows the attenuation and input impedance presented by ideal cable made up in the appropriate configuration For the attenuation graph we h...

Page 102: ...our results but we publish them so that you know they exist and can take whatever actions you believe are appropriate 10 1 CSA Loops 10 1 1 CSA Loop 1 Attenuation Impedance The bold line shows the calculated value for ideal cables the other shows values measured on a DLS 400 90 80 70 60 50 40 30 20 10 0 200 400 600 800 1000 1200 1400 1600 Frequency kHz Calculated Attenuation of Ideal Cable Attenua...

Page 103: ...ance Graphs 200 150 100 50 0 50 100 150 200 250 0 200 400 600 800 1000 1200 1400 1600 Frequency kHz At CO Side Real Imaginary 200 150 100 50 0 50 100 150 200 250 0 200 400 600 800 1000 1200 1400 1600 Frequency kHz At Customer Side Real Imaginary ...

Page 104: ...ation Impedance The bold line shows the calculated value for ideal cables the other shows values measured on a DLS 400 90 80 70 60 50 40 30 20 10 0 200 400 600 800 1000 1200 1400 1600 Frequency kHz Calculated Attenuation of Ideal Cable Attenuation Measured on DLS 400 ...

Page 105: ...ance Graphs 200 150 100 50 0 50 100 150 200 250 0 200 400 600 800 1000 1200 1400 1600 Frequency kHz At CO Side Real Imaginary 200 150 100 50 0 50 100 150 200 250 0 200 400 600 800 1000 1200 1400 1600 Frequency kHz At Customer Side Real Imaginary ...

Page 106: ...tion Impedance The bold line shows the calculated value for ideal cables the other shows values measured on a DLS 400 90 80 70 60 50 40 30 20 10 0 200 400 600 800 1000 1200 1400 1600 Frequency kHz Calculated Attenuation of Ideal Cable Attenuation Measured on DLS 400 ...

Page 107: ...ance Graphs 200 150 100 50 0 50 100 150 200 250 0 200 400 600 800 1000 1200 1400 1600 Frequency kHz At CO Side Real Imaginary 200 150 100 50 0 50 100 150 200 250 0 200 400 600 800 1000 1200 1400 1600 Frequency kHz At Customer Side Real Imaginary ...

Page 108: ...tion Impedance The bold line shows the calculated value for ideal cables the other shows values measured on a DLS 400 90 80 70 60 50 40 30 20 10 0 200 400 600 800 1000 1200 1400 1600 Frequency kHz Calculated Attenuation of Ideal Cable Attenuation Measured on DLS 400 ...

Page 109: ...ance Graphs 200 150 100 50 0 50 100 150 200 250 0 200 400 600 800 1000 1200 1400 1600 Frequency kHz At CO Side Real Imaginary 200 150 100 50 0 50 100 150 200 250 0 200 400 600 800 1000 1200 1400 1600 Frequency kHz At Customer Side Real Imaginary ...

Page 110: ...tion Impedance The bold line shows the calculated value for ideal cables the other shows values measured on a DLS 400 90 80 70 60 50 40 30 20 10 0 200 400 600 800 1000 1200 1400 1600 Frequency kHz Calculated Attenuation of Ideal Cable Attenuation Measured on DLS 400 ...

Page 111: ...ance Graphs 200 150 100 50 0 50 100 150 200 250 0 200 400 600 800 1000 1200 1400 1600 Frequency kHz At CO Side Real Imaginary 200 150 100 50 0 50 100 150 200 250 0 200 400 600 800 1000 1200 1400 1600 Frequency kHz At Customer Side Real Imaginary ...

Page 112: ...tion Impedance The bold line shows the calculated value for ideal cables the other shows values measured on a DLS 400 90 80 70 60 50 40 30 20 10 0 200 400 600 800 1000 1200 1400 1600 Frequency kHz Calculated Attenuation of Ideal Cable Attenuation Measured on DLS 400 ...

Page 113: ...dance Graphs At CO Side 200 150 100 50 0 50 100 150 200 250 0 200 400 600 800 1000 1200 1400 1600 Frequency kHz Real Imaginary 200 150 100 50 0 50 100 150 200 250 0 200 400 600 800 1000 1200 1400 1600 Frequency kHz At Customer Side Real Imaginary ...

Page 114: ...tion Impedance The bold line shows the calculated value for ideal cables the other shows values measured on a DLS 400 90 80 70 60 50 40 30 20 10 0 200 400 600 800 1000 1200 1400 1600 Frequency kHz Calculated Attenuation of Ideal Cable Attenuation Measured on DLS 400 ...

Page 115: ...dance Graphs 200 150 100 50 0 50 100 150 200 250 0 200 400 600 800 1000 1200 1400 1600 Frequency kHz At CO Side Real Imaginary 200 150 100 50 0 50 100 150 200 250 0 200 400 600 800 1000 1200 1400 1600 Frequency kHz At Customer Side Real Imaginary ...

Page 116: ...tion Impedance The bold line shows the calculated value for ideal cables the other shows values measured on a DLS 400 90 80 70 60 50 40 30 20 10 0 200 400 600 800 1000 1200 1400 1600 Frequency kHz Calculated Attenuation of Ideal Cable Attenuation Measured on DLS 400 ...

Page 117: ...aphs Real Imaginary 200 150 100 50 0 50 100 150 200 250 0 200 400 600 800 1000 1200 1400 1600 Frequency kHz At CO Side Real Imaginary 200 150 100 50 0 50 100 150 200 250 0 200 400 600 800 1000 1200 1400 1600 Frequency kHz At Customer Side Real Imaginary ...

Page 118: ...tenuation Impedance The bold line shows the calculated value for ideal cables the other shows values measured on a DLS 400 90 80 70 60 50 40 30 20 10 0 200 400 600 800 1000 1200 1400 1600 Frequency kHz Calculated Attenuation of Ideal Cable Attenuation Measured on DLS 400 ...

Page 119: ...dance Graphs At CO Side 200 150 100 50 0 50 100 150 200 250 0 200 400 600 800 1000 1200 1400 1600 Frequency kHz Real Imaginary 200 150 100 50 0 50 100 150 200 250 0 200 400 600 800 1000 1200 1400 1600 Frequency kHz At Customer Side Real Imaginary ...

Page 120: ...tenuation Impedance The bold line shows the calculated value for ideal cables the other shows values measured on a DLS 400 90 80 70 60 50 40 30 20 10 0 200 400 600 800 1000 1200 1400 1600 Frequency kHz Calculated Attenuation of Ideal Cable Attenuation Measured on DLS 400 ...

Page 121: ...dance Graphs 200 150 100 50 0 50 100 150 200 250 0 200 400 600 800 1000 1200 1400 1600 Frequency kHz At CO Side Real Imaginary 200 150 100 50 0 50 100 150 200 250 0 200 400 600 800 1000 1200 1400 1600 Frequency kHz At Customer Side Real Imaginary ...

Page 122: ...nuation Impedance The bold line shows the calculated value for ideal cables the other shows values measured on a DLS 400 90 80 70 60 50 40 30 20 10 0 200 400 600 800 1000 1200 1400 1600 Frequency kHz Calculated Attenuation of Ideal Cable Attenuation Measured on DLS 400 ...

Page 123: ...dance Graphs 200 150 100 50 0 50 100 150 200 250 0 200 400 600 800 1000 1200 1400 1600 Frequency kHz At CO Side Real Imaginary 200 150 100 50 0 50 100 150 200 250 0 200 400 600 800 1000 1200 1400 1600 Frequency kHz At Customer Side Real Imaginary ...

Page 124: ...uation Impedance The bold line shows the calculated value for ideal cables the other shows values measured on a DLS 400 90 80 70 60 50 40 30 20 10 0 200 400 600 800 1000 1200 1400 1600 Frequency kHz Calculated Attenuation of Ideal Cable Attenuation Measured on DLS 400 ...

Page 125: ...dance Graphs 200 150 100 50 0 50 100 150 200 250 0 200 400 600 800 1000 1200 1400 1600 Frequency kHz At CO Side Real Imaginary 200 150 100 50 0 50 100 150 200 250 0 200 400 600 800 1000 1200 1400 1600 Frequency kHz At Customer Side Real Imaginary ...

Page 126: ...uation Impedance The bold line shows the calculated value for ideal cables the other shows values measured on a DLS 400 90 80 70 60 50 40 30 20 10 0 200 400 600 800 1000 1200 1400 1600 Frequency kHz Calculated Attenuation of Ideal Cable Attenuation Measured on DLS 400 ...

Page 127: ...dance Graphs 200 150 100 50 0 50 100 150 200 250 0 200 400 600 800 1000 1200 1400 1600 Frequency kHz At CO Side Real Imaginary 200 150 100 50 0 50 100 150 200 250 0 200 400 600 800 1000 1200 1400 1600 Frequency kHz At Customer Side Real Imaginary ...

Page 128: ...uation Impedance The bold line shows the calculated value for ideal cables the other shows values measured on a DLS 400 90 80 70 60 50 40 30 20 10 0 200 400 600 800 1000 1200 1400 1600 Frequency kHz Calculated Attenuation of Ideal Cable Attenuation Measured on DLS 400 ...

Page 129: ...dance Graphs 200 150 100 50 0 50 100 150 200 250 0 200 400 600 800 1000 1200 1400 1600 Frequency kHz At CO Side Real Imaginary 200 150 100 50 0 50 100 150 200 250 0 200 400 600 800 1000 1200 1400 1600 Frequency kHz At Customer Side Real Imaginary ...

Page 130: ...uation Impedance The bold line shows the calculated value for ideal cables the other shows values measured on a DLS 400 90 80 70 60 50 40 30 20 10 0 200 400 600 800 1000 1200 1400 1600 Frequency kHz Calculated Attenuation of Ideal Cable Attenuation Measured on DLS 400 ...

Page 131: ...dance Graphs 200 150 100 50 0 50 100 150 200 250 0 200 400 600 800 1000 1200 1400 1600 Frequency kHz At CO Side Real Imaginary 200 150 100 50 0 50 100 150 200 250 0 200 400 600 800 1000 1200 1400 1600 Frequency kHz At Customer Side Real Imaginary ...

Page 132: ...uation Impedance The bold line shows the calculated value for ideal cables the other shows values measured on a DLS 400 90 80 70 60 50 40 30 20 10 0 200 400 600 800 1000 1200 1400 1600 Frequency kHz Calculated Attenuation of Ideal Cable Attenuation Measured on DLS 400 ...

Page 133: ...dance Graphs 200 150 100 50 0 50 100 150 200 250 0 200 400 600 800 1000 1200 1400 1600 Frequency kHz At CO Side Real Imaginary 200 150 100 50 0 50 100 150 200 250 0 200 400 600 800 1000 1200 1400 1600 Frequency kHz At Customer Side Real Imaginary ...

Page 134: ...uation Impedance The bold line shows the calculated value for ideal cables the other shows values measured on a DLS 400 90 80 70 60 50 40 30 20 10 0 200 400 600 800 1000 1200 1400 1600 Frequency kHz Calculated Attenuation of Ideal Cable Attenuation Measured on DLS 400 ...

Page 135: ...dance Graphs 200 150 100 50 0 50 100 150 200 250 0 200 400 600 800 1000 1200 1400 1600 Frequency kHz At CO Side Real Imaginary 200 150 100 50 0 50 100 150 200 250 0 200 400 600 800 1000 1200 1400 1600 Frequency kHz At Customer Side Real Imaginary ...

Page 136: ...ttenuation Impedance The bold line shows the calculated value for ideal cables the other shows values measured on a DLS 400 90 80 70 60 50 40 30 20 10 0 0 50 100 150 200 250 300 350 400 450 500 Frequency kHz Calculated Attenuation of Ideal Cable Attenuation Measured on DLS 400 ...

Page 137: ...dance Graphs 200 150 100 50 0 50 100 150 200 250 0 200 400 600 800 1000 1200 1400 1600 Frequency kHz At CO Side Real Imaginary 200 150 100 50 0 50 100 150 200 250 0 200 400 600 800 1000 1200 1400 1600 Frequency kHz At Customer Side Real Imaginary ...

Page 138: ...on Impedance The bold line shows the calculated value for ideal cables the other shows values measured on a DLS 400 90 80 70 60 50 40 30 20 10 0 0 50 100 150 200 250 300 350 400 450 500 Frequency kHz Calculated Attenuation of Ideal Cable Attenuation Measured on DLS 400 ...

Page 139: ...dance Graphs 200 150 100 50 0 50 100 150 200 250 0 200 400 600 800 1000 1200 1400 1600 Frequency kHz At CO Side Real Imaginary 200 150 100 50 0 50 100 150 200 250 0 200 400 600 800 1000 1200 1400 1600 Frequency kHz At Customer Side Real Imaginary ...

Page 140: ...on Impedance The bold line shows the calculated value for ideal cables the other shows values measured on a DLS 400 90 80 70 60 50 40 30 20 10 0 0 50 100 150 200 250 300 350 400 450 500 Frequency kHz Calculated Attenuation of Ideal Cable Attenuation Measured on DLS 400 ...

Page 141: ...dance Graphs 200 150 100 50 0 50 100 150 200 250 0 200 400 600 800 1000 1200 1400 1600 Frequency kHz At CO Side Real Imaginary 200 150 100 50 0 50 100 150 200 250 0 200 400 600 800 1000 1200 1400 1600 Frequency kHz At Customer Side Real Imaginary ...

Page 142: ...on Impedance The bold line shows the calculated value for ideal cables the other shows values measured on a DLS 400 90 80 70 60 50 40 30 20 10 0 0 50 100 150 200 250 300 350 400 450 500 Frequency kHz Calculated Attenuation of Ideal Cable Attenuation Measured on DLS 400 ...

Page 143: ...dance Graphs 200 150 100 50 0 50 100 150 200 250 0 200 400 600 800 1000 1200 1400 1600 Frequency kHz At CO Side Real Imaginary 200 150 100 50 0 50 100 150 200 250 0 200 400 600 800 1000 1200 1400 1600 Frequency kHz At Customer Side Real Imaginary ...

Page 144: ...on Impedance The bold line shows the calculated value for ideal cables the other shows values measured on a DLS 400 90 80 70 60 50 40 30 20 10 0 0 50 100 150 200 250 300 350 400 450 500 Frequency kHz Calculated Attenuation of Ideal Cable Attenuation Measured on DLS 400 ...

Page 145: ...dance Graphs 200 150 100 50 0 50 100 150 200 250 0 200 400 600 800 1000 1200 1400 1600 Frequency kHz At CO Side Real Imaginary 200 150 100 50 0 50 100 150 200 250 0 200 400 600 800 1000 1200 1400 1600 Frequency kHz At Customer Side Real Imaginary ...

Page 146: ...on Impedance The bold line shows the calculated value for ideal cables the other shows values measured on a DLS 400 90 80 70 60 50 40 30 20 10 0 0 50 100 150 200 250 300 350 400 450 500 Frequency kHz Calculated Attenuation of Ideal Cable Attenuation Measured on DLS 400 ...

Page 147: ...dance Graphs 200 150 100 50 0 50 100 150 200 250 0 200 400 600 800 1000 1200 1400 1600 Frequency kHz At CO Side Real Imaginary 200 150 100 50 0 50 100 150 200 250 0 200 400 600 800 1000 1200 1400 1600 Frequency kHz At Customer Side Real Imaginary ...

Page 148: ...on Impedance The bold line shows the calculated value for ideal cables the other shows values measured on a DLS 400 90 80 70 60 50 40 30 20 10 0 0 50 100 150 200 250 300 350 400 450 500 Frequency kHz Calculated Attenuation of Ideal Cable Attenuation Measured on DLS 400 ...

Page 149: ...dance Graphs 200 150 100 50 0 50 100 150 200 250 0 200 400 600 800 1000 1200 1400 1600 Frequency kHz At CO Side Real Imaginary 200 150 100 50 0 50 100 150 200 250 0 200 400 600 800 1000 1200 1400 1600 Frequency kHz At Customer Side Real Imaginary ...

Page 150: ...on Impedance The bold line shows the calculated value for ideal cables the other shows values measured on a DLS 400 90 80 70 60 50 40 30 20 10 0 0 50 100 150 200 250 300 350 400 450 500 Frequency kHz Calculated Attenuation of Ideal Cable Attenuation Measured on DLS 400 ...

Page 151: ...dance Graphs 200 150 100 50 0 50 100 150 200 250 0 200 400 600 800 1000 1200 1400 1600 Frequency kHz At CO Side Real Imaginary 200 150 100 50 0 50 100 150 200 250 0 200 400 600 800 1000 1200 1400 1600 Frequency kHz At Customer Side Real Imaginary ...

Page 152: ...on Impedance The bold line shows the calculated value for ideal cables the other shows values measured on a DLS 400 90 80 70 60 50 40 30 20 10 0 0 50 100 150 200 250 300 350 400 450 500 Frequency kHz Calculated Attenuation of Ideal Cable Attenuation Measured on DLS 400 ...

Page 153: ...dance Graphs 200 150 100 50 0 50 100 150 200 250 0 200 400 600 800 1000 1200 1400 1600 Frequency kHz At CO Side Real Imaginary 200 150 100 50 0 50 100 150 200 250 0 200 400 600 800 1000 1200 1400 1600 Frequency kHz At Customer Side Real Imaginary ...

Page 154: ...ion Impedance The bold line shows the calculated value for ideal cables the other shows values measured on a DLS 400 90 80 70 60 50 40 30 20 10 0 0 50 100 150 200 250 300 350 400 450 500 Frequency kHz Calculated Attenuation of Ideal Cable Attenuation Measured on DLS 400 ...

Page 155: ...dance Graphs 200 150 100 50 0 50 100 150 200 250 0 200 400 600 800 1000 1200 1400 1600 Frequency kHz At CO Side Real Imaginary 200 150 100 50 0 50 100 150 200 250 0 200 400 600 800 1000 1200 1400 1600 Frequency kHz At Customer Side Real Imaginary ...

Page 156: ...ion Impedance The bold line shows the calculated value for ideal cables the other shows values measured on a DLS 400 90 80 70 60 50 40 30 20 10 0 0 50 100 150 200 250 300 350 400 450 500 Frequency kHz Calculated Attenuation of Ideal Cable Attenuation Measured on DLS 400 ...

Page 157: ...dance Graphs 200 150 100 50 0 50 100 150 200 250 0 200 400 600 800 1000 1200 1400 1600 Frequency kHz At CO Side Real Imaginary 200 150 100 50 0 50 100 150 200 250 0 200 400 600 800 1000 1200 1400 1600 Frequency kHz At Customer Side Real Imaginary ...

Page 158: ...ion Impedance The bold line shows the calculated value for ideal cables the other shows values measured on a DLS 400 90 80 70 60 50 40 30 20 10 0 0 50 100 150 200 250 300 350 400 450 500 Frequency kHz Calculated Attenuation of Ideal Cable Attenuation Measured on DLS 400 ...

Page 159: ...dance Graphs 200 150 100 50 0 50 100 150 200 250 0 200 400 600 800 1000 1200 1400 1600 Frequency kHz At CO Side Real Imaginary 200 150 100 50 0 50 100 150 200 250 0 200 400 600 800 1000 1200 1400 1600 Frequency kHz At Customer Side Real Imaginary ...

Page 160: ...ion Impedance The bold line shows the calculated value for ideal cables the other shows values measured on a DLS 400 90 80 70 60 50 40 30 20 10 0 0 50 100 150 200 250 300 350 400 450 500 Frequency kHz Calculated Attenuation of Ideal Cable Attenuation Measured on DLS 400 ...

Page 161: ...dance Graphs 200 150 100 50 0 50 100 150 200 250 0 200 400 600 800 1000 1200 1400 1600 Frequency kHz At CO Side Real Imaginary 200 150 100 50 0 50 100 150 200 250 0 200 400 600 800 1000 1200 1400 1600 Frequency kHz At Customer Side Real Imaginary ...

Page 162: ...tenuation Impedance The bold line shows the calculated value for ideal cables the other shows values measured on a DLS 400 90 80 70 60 50 40 30 20 10 0 100 200 300 400 500 600 700 800 Frequency kHz Calculated Attenuation of Ideal Cable Attenuation Measured on DLS 400 ...

Page 163: ...dance Graphs 200 150 100 50 0 50 100 150 200 250 0 200 400 600 800 1000 1200 1400 1600 Frequency kHz At CO Side Real Imaginary 200 150 100 50 0 50 100 150 200 250 0 200 400 600 800 1000 1200 1400 1600 Frequency kHz At Customer Side Real Imaginary ...

Page 164: ...1 Attenuation Impedance The bold line shows the calculated value for ideal cables the other shows values measured on a DLS 400 40 35 30 25 20 15 10 5 0 0 200 400 600 800 1000 1200 1400 1600 Frequency kHz Calculated Attenuation of Ideal Cable Attenuation Measured on DLS 400 ...

Page 165: ...dance Graphs 200 150 100 50 0 50 100 150 200 250 0 200 400 600 800 1000 1200 1400 1600 Frequency kHz At CO Side Real Imaginary 200 150 100 50 0 50 100 150 200 250 0 200 400 600 800 1000 1200 1400 1600 Frequency kHz At Customer Side Real Imaginary ...

Page 166: ...ation Impedance The bold line shows the calculated value for ideal cables the other shows values measured on a DLS 400 80 70 60 50 40 30 20 10 0 0 200 400 600 800 1000 1200 1400 1600 Frequency kHz Calculated Attenuation of Ideal Cable Attenuation Measured on DLS 400 ...

Page 167: ...dance Graphs 200 150 100 50 0 50 100 150 200 250 0 200 400 600 800 1000 1200 1400 1600 Frequency kHz At CO Side Real Imaginary 200 150 100 50 0 50 100 150 200 250 0 200 400 600 800 1000 1200 1400 1600 Frequency kHz At Customer Side Real Imaginary ...

Page 168: ...ation Impedance The bold line shows the calculated value for ideal cables the other shows values measured on a DLS 400 80 70 60 50 40 30 20 10 0 0 200 400 600 800 1000 1200 1400 1600 Frequency kHz Calculated Attenuation of Ideal Cable Attenuation Measured on DLS 400 ...

Page 169: ...dance Graphs 200 150 100 50 0 50 100 150 200 250 0 200 400 600 800 1000 1200 1400 1600 Frequency kHz At CO Side Real Imaginary 200 150 100 50 0 50 100 150 200 250 0 200 400 600 800 1000 1200 1400 1600 Frequency kHz At Customer Side Real Imaginary ...

Page 170: ...on Impedance The bold line shows the calculated value for ideal cables the other shows values measured on a DLS 400 90 80 70 60 50 40 30 20 10 0 0 50 100 150 200 250 300 350 400 450 500 Frequency kHz Calculated Attenuation of Ideal Cable Attenuation Measured on DLS 400 ...

Page 171: ...dance Graphs 200 150 100 50 0 50 100 150 200 250 0 200 400 600 800 1000 1200 1400 1600 Frequency kHz At CO Side Real Imaginary 200 150 100 50 0 50 100 150 200 250 0 200 400 600 800 1000 1200 1400 1600 Frequency kHz At Customer Side Real Imaginary ...

Page 172: ...on Impedance The bold line shows the calculated value for ideal cables the other shows values measured on a DLS 400 90 80 70 60 50 40 30 20 10 0 0 50 100 150 200 250 300 350 400 450 500 Frequency kHz Calculated Attenuation of Ideal Cable Attenuation Measured on DLS 400 ...

Page 173: ...dance Graphs 200 150 100 50 0 50 100 150 200 250 0 200 400 600 800 1000 1200 1400 1600 Frequency kHz At CO Side Real Imaginary 200 150 100 50 0 50 100 150 200 250 0 200 400 600 800 1000 1200 1400 1600 Frequency kHz At Customer Side Real Imaginary ...

Page 174: ...ACTERISTICS OF IMPAIRMENTS 11 1 Noise shapes produced by Generators A B Figure 11 1 T1 601 NEXT Figure 11 2 DSL NEXT 140 130 120 110 100 90 80 0 100 200 300 400 500 600 Frequency kHz 140 130 120 110 100 90 80 0 100 200 300 400 500 600 Frequency kHz ...

Page 175: ...STICS OF IMPAIRMENTS Page 163 Figure 11 3 HDSL NEXT Figure 11 4 HDSL ADSL NEXT 150 140 130 120 110 100 90 0 100 200 300 400 500 600 Frequency kHz 140 130 120 110 100 90 80 0 100 200 300 400 500 600 Frequency kHz ...

Page 176: ... 164 Figure 11 5 T1 413 II EC ADSL upstream NEXT Figure 11 6 T1 413 II EC ADSL upstream FEXT 9 kft 26 AWG 140 130 120 110 100 90 80 0 50 100 150 200 250 300 Frequency kHz 150 145 140 135 130 125 120 0 50 100 150 200 250 300 Frequency kHz ...

Page 177: ...ure 11 7 T1 413 II FDM ADSL upstream NEXT ITU T NA ADSL Upstream NEXT Figure 11 8 ITU T NA FDM ADSL Downstream FEXT 150 140 130 120 110 100 90 80 0 100 200 300 400 500 600 Frequency kHz 150 145 140 135 130 0 100 200 300 400 500 600 Frequency kHz ...

Page 178: ...AIRMENTS Page 166 Figure 11 9 ITU T NA ADSL Upstream FEXT Figure 11 10 HDSL2 downstream NEXT H2TUC 150 145 140 135 130 0 50 100 150 200 250 300 Frequency kHz 140 130 120 110 100 90 80 0 100 200 300 400 500 600 Frequency kHz ...

Page 179: ...RMENTS Page 167 Figure 11 11 HDSL2 upstream NEXT H2TUR Figure 11 12 ITU T Euro K or Kirkby noise 140 130 120 110 100 90 80 0 100 200 300 400 500 600 Frequency kHz 140 130 120 110 100 90 80 0 200 400 600 800 1000 Frequency kHz ...

Page 180: ...168 11 2 Noise shapes produced by Generator C Figure 11 13 ADSL FEXT T1 413 Issue I II Figure 11 14 Model A 150 145 140 135 130 125 120 0 200 400 600 800 1000 1200 Frequency kHz 140 130 120 110 100 90 80 70 10 100 1000 10000 Frequency kHz ...

Page 181: ...RMENTS Page 169 Figure 11 15 Model B Figure 11 16 T1 NEXT Original DLS 400A shape 115 110 105 100 95 90 85 80 1 10 100 1000 Frequency kHz 140 130 120 110 100 90 80 0 200 400 600 800 1000 1200 1400 1600 1800 2000 Frequency kHz ...

Page 182: ...70 Figure 11 17 International AMI Figure 11 18 T1 413 II T1 AMI NEXT ITU T NA T1 AMI NEXT HDSL2 T1 AMI NEXT 140 130 120 110 100 90 80 0 500 1000 1500 2000 2500 Frequency kHz 70 60 50 40 30 20 10 0 10 0 500 1000 1500 2000 2500 Frequency kHz ...

Page 183: ...ENTS Page 171 Figure 11 19 T1 413 II EC ADSL downstream NEXT Figure 11 20 HDSL2 EC ADSL downstream NEXT 140 130 120 110 100 90 80 0 600 1200 1800 2400 Frequency kHz 140 130 120 110 100 90 80 70 0 600 1200 1800 2400 Frequency kHz ...

Page 184: ...SL downstream FEXT 9kft 26 AWG Figure 11 22 ITU T NA FDM ADSL downstream NEXT HDSL2 FDM ADSL downstream NEXT T1 413 II FDM ADSL downstream NEXT 150 145 140 135 130 125 120 0 600 1200 1800 2400 Frequency kHz 140 130 120 110 100 90 80 70 0 600 1200 1800 2400 Frequency kHz ...

Page 185: ...p and a reset 4 The remote LED is red The DLS 400 received an invalid command from the control computer See section 3 7 for more details 5 The DLS400 program gives a communication error Check that the GPIB and VISA drivers are installed If using the serial interface Check that no device such as a mouse is connected to the same serial COM port as the DLS 400 If using the IEEE 488 interface 1 Check ...

Page 186: ...s 6 The DLS 400 does not raise SRQ after a query You must enable all the relevant bits before using SRQ For example to raise SRQ when there is a message available MAV send the command SRE 16 See sections 7 1 2 and 8 1 for more details If the remote LED is red you may have sent an invalid command See chapter 8 for more details Queries must be terminated with a question mark ...

Page 187: ...e Secretariat 06921 Sophia Antipolis Cedex France Tel 33 92 94 4200 Fax 33 93 65 4716 ETSI TS 101 135 Transmission and Multiplexing TM High bit rate Digital Sub scriber Line HDSL Transmission Systems on Metallic Local Lines European Tele communication Standards Institute Secretariat 06921 Sophia Antipolis Cedex France Tel 33 92 94 4200 Fax 33 93 65 4716 ETSI RTR TM 03036 High Bit Rate Digital Subs...

Page 188: ...Phone 619 697 8790 Fax 619 697 5955 ITU T G 992 2 Draft formerly G lite Splitterless Asymmetric Digital Subscriber Line ADSL Transceivers International Telecommunication Union Place des Nations CH1211 Geneva 20 Switzerland ETSI ETR 328 Asymmetric Digital Subscriber Line ADSL Requirements and Per formance European Telecommunications Standards Institute F 06921 Sophia Antip olis Cedex France ...

Page 189: ...ion the cost of which shall be prepaid by DLS TestWorks Consultronics In no event shall this warranty apply to equipment which has been modified without the written authorization of DLS TestWorks Consultronics or which has been subjected to abuse neglect accident or improper application If inspection by DLS TestWorks Con sultronics discloses that the repairs required to be made on the equipment ar...

Page 190: ...tation by a representative or agent of DLS TestWorks Consultronics be effective to extend the warranty coverage provided herein In no event including but not limited to the negligence of DLS TestWorks Consultron ics its agents or employees shall DLS TestWorks Consultronics be liable for special consequential damages or damages arising from the loss of use of the equipment and on the expiration of ...

Page 191: ...ator in the original carton Do not place any cables or accessories directly against the front panel as this may scratch the surface of the unit We suggest that you mark all shipments with labels indicating that the contents are fragile If sending a unit back to the factory ensure that the return authorization number given by our customer service department is shown on the outside ...

Page 192: ...rogrammable Interfaces SCPI standard 16 2 Simulated loops 16 2 1 DLS 400 Unit Configurations Depending upon the configuration chosen the DLS 400 can simulate up to 29 different loops defined in various standards plus 4 variable loops DLS 400A BYPASS CSA 0 MID CSA 0 ANSI 2 CSA 1 MID CSA 1 ANSI 3 VARIABLE 24 AWG CSA 2 MID CSA 2 ANSI 4 VAR 24 AWG TAP CSA 4 MID CSA 3 ANSI 5 VARIABLE 26 AWG CSA 5 MID C...

Page 193: ... 24 AWG TAP CSA 4 VARIABLE 26 AWG CSA 5 VAR 26 AWG TAP CSA 6 CSA 7 CSA 8 EXT CSA 9 EXT CSA 10 BYPASS CSA 4 ANSI 1 EIA 1 CSA 6 ANSI 2 EIA 2 VARIABLE 24 AWG CSA 7 ANSI 5 EIA 3 VAR 24 AWG TAP CSA 8 ANSI 7 EIA 4 VARIABLE 26 AWG MID CSA 6 ANSI 8 EIA 5 VAR 26 AWG TAP ANSI 9 ANSI 13 MID ANSI 7 ...

Page 194: ...C Rating up to 300 VDC between tip and ring tip and ground or ring and ground 100 mA 150 mA peak Bandwidth DC to 2 0 MHz Accuracy For the specified bandwidth 0 5 dB for all attenuations up to 20 dB for attenuation from 20 to 70 dB the tolerance is within 5 of design to a maximum of 1 5 dB BYPASS CSA 1 ANSI 1 EIA 1 CSA 2 ANSI 2 EIA 2 VARIABLE 24 AWG CSA 3 ANSI 5 EIA 3 VAR 24 AWG TAP CSA 4 ANSI 7 EI...

Page 195: ... DLS 400 Wireline Simulator and consists of seven discrete generation sections The features associated with one gener ator operate independently of the others However the options within a section can only be activated one at a time The seven sections are White noise generator 2 x low frequency 500 kHz NEXT shaped PSD generator 1 x high frequency 2 0 MHz NEXT shaped PSD generator Multi Tone generat...

Page 196: ...te its null fre quencies by 5 0 Shapes The following shapes are available in Generators A and B ANSI T1 601 320 KHz bandwidth ANSI HDSL Technical report DSL Next ANSI HDSL Technical report HDSL Next ANSI T1 413 Issue I ADSL HDSL Next and Generator B also provides these shapes ANSI T1 413 Issue I ADSL Next ANSI T1 413 Issue II ADSL upstream NEXT ANSI T1 413 Issue II ADSL upstream FEXT 9 kft 26 AWG ...

Page 197: ...e in the High Frequency NEXT Generator ANSI T1 413 Issue I ADSL FEXT ETSI ETR 328 Model A ETSI ETR 328 Model B North American 1 544 MBps T1 International 2 048 MBps AMI ANSI T1 413 Issue II T1 AMI NEXT ANSI T1 413 Issue II EC ADSL downstream NEXT ANSI T1 413 Issue II FDM downstream FEXT 9kft 26 AWG ITU T G 996 1 G test EC ADSL downstream NEXT ITU T G 996 1 G test FDM ADSL downstream NEXT 16 3 4 Mu...

Page 198: ...0 1 mV steps Cook 20 to 6 dB relative to the reference 0 1 dB steps 16 3 6 Powerline Related Metallic Noise Type Dual tones as per ANSI T1 601 Level 15 0 to 9 0 dB relative to ANSI reference levels 0 1 dB steps 16 3 7 Longitudinal Noise Type Triangular waveform Frequency 50 or 60 Hz Level 0 60 Volts rms at 60 Hz 0 50 Volts at 50 Hz 1 volt steps Injection Balanced transformer at 25 75 of loop lengt...

Page 199: ...acks and 3 pin balanced CF 16 5 IEEE 488 Remote Control The unit can be controlled via an IEEE 488 interface The unit supports the following functions 1 Listener 2 Talker 3 Local Lockout 4 Serial Poll 5 Selective Device Reset 6 Bus Reset 7 Primary Addressing from 0 to 30 16 6 RS 232 Remote Control The unit can be controlled via an RS 232 serial interface The unit is configured with 9600 bps baud r...

Page 200: ...ments GPIB PCII interface card 16 9 Electrical 16 9 1 AC Power Rated Input Voltage 100 240 VAC 10 Rated Frequency 50 60 Hz Rated Power consumption 140VA max Line Fuses Type T 2A 250V SLOW BLOW 2 required 5mm x 20mm 16 9 2 On Simulated Wireline 300 Volts maximum peak AC DC voltage between Tip and Ring or Tip and Ground or Ring and Ground Maximum Current 100 mA DC sustained 150 mA peak ...

Page 201: ...order for the unit to operate correctly and safely it must be adequately ventilated The DLS 400 contains ventilation holes for cooling Do not install the equipment in any loca tion where the ventilation is blocked For optimum performance the equipment must be operated in a location that provides at least 10 mm of clearance from the ventilation holes Blocking the air circulation around the equipmen...

Page 202: ...sure that the equipment is used and maintained safely WARNING To avoid risk of injury or death ALWAYS observe the following precau tions before operating the unit Use only a power supply cord with a protective grounding terminal Connect the power supply cord only to a power outlet equipped with a protective earth contact Never connect to an extension cord that is not equipped with this fea ture Do...

Page 203: ...y cord When connected to an appropriate AC power receptacle this cord grounds the equipment chassis 17 1 6 Operating Environment To prevent potential fire or shock hazard do not expose the equipment to any source of excessive moisture 17 1 7 Class of Equipment The unit consists of an exposed metal chassis that is connected directly to earth via the power supply cord In accordance with the HARMONIZ...

Page 204: ...f an interruption to the protective grounding is suspected Ensure that the instrument remains inoperative Use only the type of fuse specified Do not use repaired fuses and avoid any situation that could short circuit the fuse Unless absolutely necessary do not attempt to adjust or perform any maintenance or repair procedure when the equipment is opened and connected to a power source at the same t...

Page 205: ...ged even when the equipment is not connected the power source 17 3 Symbols When any of these symbols appear on the unit this is their meaning EQUIPOTENTIALITY FUNCTIONAL EARTH TERMINAL PROTECTIVE GROUNDING CONDUCTOR TERMINAL CAUTION REFER TO ACCOMPANYING DOCUMENTS ...

Page 206: ......

Page 207: ...ms of Units that are used 1 µV Hz Is independent of the Load Impedance and the bandwidth of the measuring device It therefore requires the most manipulation to be translated into a meter read ing 2 dBm Hz Is independent of the bandwidth of the meter but not of the impedance Therefore when using a setting of X dBm Hz the Load Impedance must be previ ously defined 3 dBm Is related to both Load Imped...

Page 208: ...ertain number of dB use the following formula Assume x is the amount to change the µV Hz setting by and the dB change required is 6 dB x 10 y 20 10 6 20 0 50 Therefore the original setting in µV Hz should be multiplied by 0 50 to give a change of 6 dB B To change a level in dBm Hz by a certain number of dB simply change the dBm Hz setting by the required amount An examination of the formula on the...

Page 209: ...e calibrated using a 50 Ω load Crosstalk Noises ADSL FEXT ADSL NEXT ADSL MODEL A ADSL MODEL B T1 E1 AMI ADSL HDSL White Noise Impulses Complex Impulse A and B used in ANSI ADSL testing These impairments are calibrated using a 67 5 Ω load Crosstalk Noises DSL HDSL Shaped Noises ISDN ETSI HDSL ETSI FTZ Impulses 3 LEVEL COOK PULSE These are calibrated using a load of 135 Ω in parallel with an ANSI Lo...

Page 210: ...t was tested using a DLS 400 with resulting confusion The enhance ment enables users to test using a DLS 200 Compatible mode if they wish Of course the original DLS 400 mode is still available so that users can obtain the same test results they got in the past using a DLS 400 The enhancement can be retro fitted if desired to all DLS 400s and is standard on present production This manual describes ...

Page 211: ... may be made up of several different gauges of wire it is usually ter minated in a real load There are several common ways to measure the amplitude response of electronic systems Referring to the figure these are 1 The amplitude of the TRANSFER FUNCTION from BB to CC 2 Some engineers include the source resistors in the system and measure from AA to CC 3 Yet others measure using method 2 subtract 6...

Page 212: ...so approximately 1 1000 of the input voltage or 1 1000000 of the input power is present on the output It is very easy for transformers or even wires placed close to each other to couple together far more than this Take care to keep inputs and outputs separate The use of a high impedance measuring device with no load from tip to ring at the receive end This results in reflections due to a bad misma...

Page 213: ...od of determining the quality of the received data In many cases they are Consultronics Lynx testers This is shown here diagrammatically assuming one noise generator is used Simulators such as the Consultronics DLS 400 E DLS 200 and DLS 100A can all con tain both the wireline simulation and the noise generator and is the equipment enclosed in the dotted lines You do not have to worry about connect...

Page 214: ...ral names such as mini bantam mini 310 bantam telco jack For the DLS 400 there are bantam jacks front and back and CF connectors on the front On side A of the unit all 3 of these connectors are equivalent and internally connected You may connect to any or all of them The same is true for side B Of course if you connect to two of them this joins the two plugs electri cally together Sometimes you ma...

Page 215: ... are shown in the diagrams below Noise Gen Test Set Modem DLS 400J Modem Wireline Test Set For the RJ 45 connectors pins 4 and 5 the centre 2 pins are the ones which carry the signal If you wish you can use an RJ 11 plug A CF plug looks like the diagram at the right There are 3 prongs spaced une venly as shown You can use banana plugs if the correctly spaced CF connec tor is not available The bant...

Page 216: ...ts disconnect from the loop by clicking off in the impair ments check box Q What loads do you use to calibrate impairments A For ISDN and HDSL specified noises we generally set the loop length to 0 and pro vide a 67 5 Ω load at the terminal where the generator is located Then we measure the voltage For two types of impairments specified by ANSI Crosstalk Noise type ANSI FULL BW and Powerline Noise...

Page 217: ...load as the one used for calibrating the module with the possible exception of the ANSI special load and one of the ANSI loops Q Why do I have to use a balanced meter to measure noise levels from the DLS 400 What happens if I just use the meter that I already have A The Transmitters Receivers under test provide a balanced load so we should measure them the same way Most meters ground one connectio...

Page 218: ...are stored in volatile RAM which means that if the unit is turned off or if another crosstalk noise is selected including OFF the entire programming sequence needs to be re sent The following example describes how to send the file HDSL2 Dn NEXT H2TUC Lo1 Rev 00 to the simulator An entire captured programming sequence is also shown This identifies the loaded xtalk shape This is generally the same n...

Page 219: ... precedes the minimum requirement Any revision equal to or greater than the value which follows this symbol will be considered compatible In this example the file can only be downloaded if the FLASHLO rev is equal to or higher than 10 AND if the CONTROLLER rev is 16 or higher Get the FLASHLO rev by issuing the command sourcea test revision flashlo Get the CONTROLLER rev by issuing the command IDN ...

Page 220: ...exadeci mal value is followed by an h a binary value is followed by a b and a decimal does not have any suffix Any blank line should be discarded Send sourcea xtalka program data xx yy zz for the mux setting and FIR parame ters in 1 command This information will be contained in the next 8 lines Send sourcea xtalka program data xx yy zz for the FIR coefficients This would require several commands T...

Page 221: ...db 03Bh 0FFh 076h 0FFh File 0 0041810000 db 0E7h 0CAh 0FBh 0FFh File 0 0001284000 db 047h 021h 0C9h 000h File 0 0061380000 db 067h 0B7h 096h 0FFh File 0 0032130000 db 0E8h 04Dh 045h 000h File 0 0021150000 db 0A4h 076h 01Ah 000h File 0 0008076000 db 0EBh 06Eh 09Eh 0FEh File 0 0107900000 db 015h 01Dh 0C9h 001h File 0 0139500000 db 0FEh 026h 014h 002h File 0 0162400000 db 0FDh 0D9h 08Fh 0FCh File 0 0...

Page 222: ...x yy zz command has been received If a type command is sent e g sourcea xtalka type t1 601 the user defined shape will stop being generated and the selected one will become active To re enable the user defined shape re do the entire programming sequence If for any reason the process needs to be cancelled when programming the user shape send the sourcea xtalka type OFF command to avoid using incomp...

Page 223: ...PROGRAM DATA 47 21 C9 00 67 B7 96 FF ESR SOURCEA XTALKA PROGRAM DATA E8 4D 45 00 A4 76 1A 00 ESR SOURCEA XTALKA PROGRAM DATA EB 6E 9E FE 15 1D C9 01 ESR SOURCEA XTALKA PROGRAM DATA FE 26 14 02 FD D9 8F FC ESR SOURCEA XTALKA PROGRAM DATA 37 A7 92 FF DB F9 7E 02 ESR SOURCEA XTALKA PROGRAM DATA 05 86 AC FE 7A FC DE 02 ESR SOURCEA XTALKA PROGRAM DATA FB 5C 6D 01 4A 46 CE F6 ESR SOURCEA XTALKA PROGRAM ...

Page 224: ......

Page 225: ...75 185 186 197 ETSI BASIC 44 ETSI HDSL 44 50 185 F Fuse 6 191 Fuses 188 G Grounding 190 H HDSL NEXT 43 48 163 HDSL ADSL 43 48 81 I IEEE 2 3 4 6 7 9 10 13 25 56 57 58 59 60 61 62 64 66 70 173 175 180 187 188 IEEE 488 13 IFC 58 Installation 9 13 Interface Clear 58 ISDN 25 38 40 53 175 183 185 197 204 L LED 5 8 9 59 61 65 173 174 Longitudinal Noise 39 40 41 53 87 186 M MAV 57 59 67 68 69 70 71 174 Me...

Page 226: ... 67 68 70 RS 232 13 S Safety 191 Serial Poll 70 187 Shaped Noise Generator 50 83 84 SRER 67 SRQ 56 57 58 59 65 67 70 71 72 174 Standards 175 Status Byte 57 58 59 64 67 69 70 STB 59 64 67 69 72 Symbols 193 Synchronization 65 66 69 71 T T1 601 39 43 45 48 81 162 175 183 186 197 T1E1 38 39 W White Noise Generator 50 84 183 Wireline 1 4 183 187 199 ...

Reviews: