


13
6.
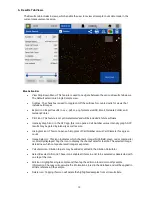
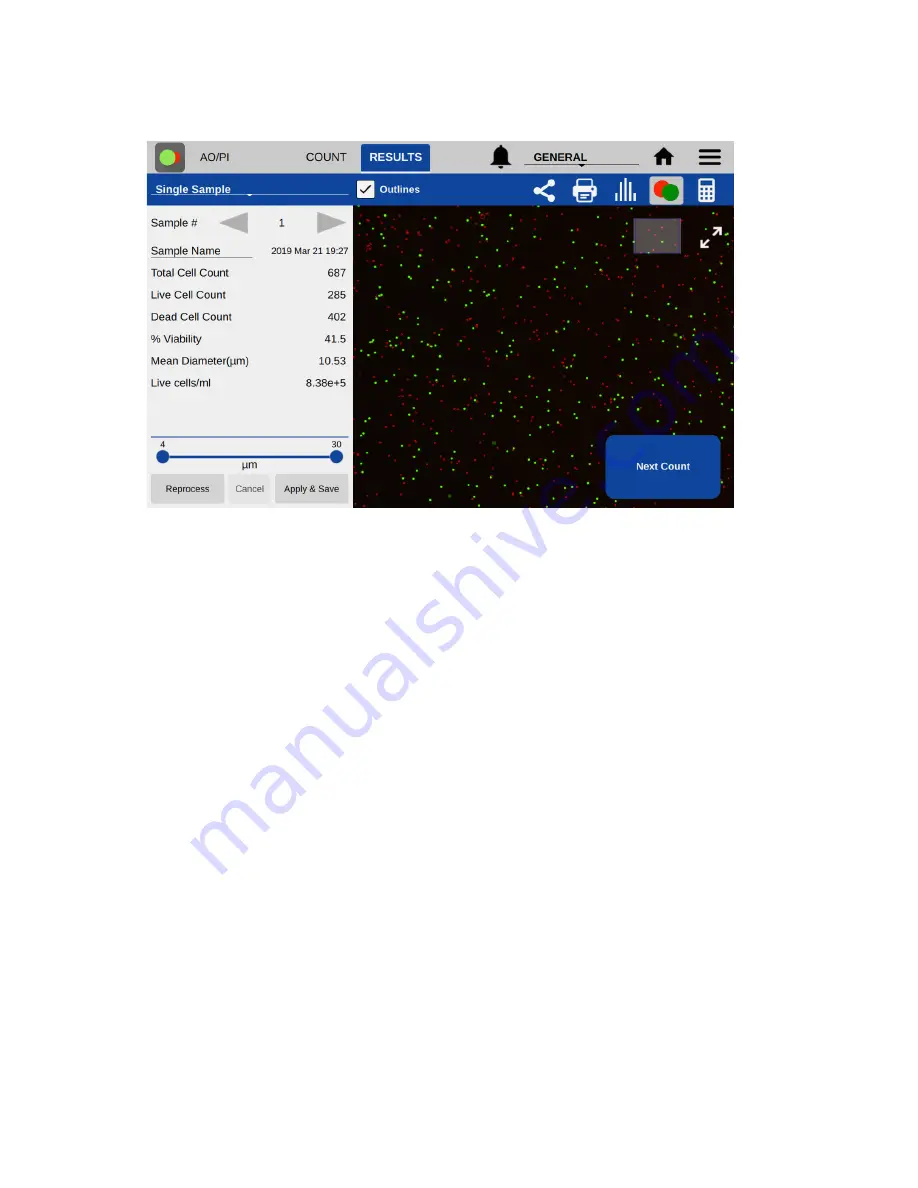
Results Tab Views
The Results tab includes 6 views, which enable the user to review all sample count data made in the
current measurement session.
Blue Action Bar
•
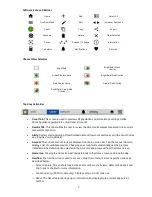
View Drop-Down Menu: This feature is used to navigate between the various Results tab views.
The Default selection is Single Sample view.
•
Outlines: The checkbox is used to toggle on/off the outlines for counted cells for views that
include cell images.
•
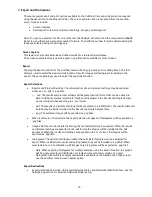
Export icon: Export results in .csv, .pdf, or .png formats via USB, Email, Network Folder, and
Network Printer.
•
Print icon:
This feature is not yet implemented and will be included in future software.
•
Intensity Graph icon: In the GFP app, this icon opens a Cell Number versus Intensity graph. GFP
results may be gated by intensity as well as size.
•
Histogram icon: This icon opens a histogram of Cell Number versus Cell Diameter for a given
count.
•
Image Selector: This icon indicates which channel’s image (brightfield, green, red or composite)
is currently displayed. Tap the icon to display the channel selector feature. The selected image
determines which composite result image is exported.
•
Calculator icon: Dilution targets may be added or edited in the Dilution Calculator.
•
Select/Deselect All icons: These icons enable all items in a list to be selected or deselected with
one tap of the icon.
•
Edit icon: Highlight a single sample and then tap the edit icon to add or modify sample
information. Changes will overwrite the information stored in the database and will be applied in
all lists referencing the sample.
•
Delete icon: Tapping this icon will delete the highlighted samples from all results lists.
Summary of Contents for CellDrop
Page 1: ...rev MAR 27 2019 ...


