


36
Dell DVS Simplified Appliance Reference Architecture
7.1
Testing Summary
7.1.1
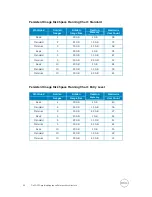
End User Experience Testing Summary
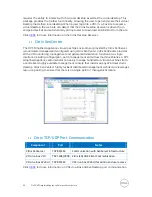
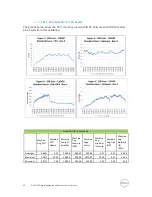
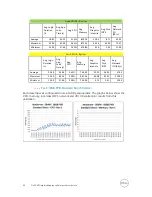
Stratusphere UX was used during each test run to gather data relating to User Experience
and desktop performance. Data was gathered at the Host and Virtual Machine layers and
reported back to a central server (Stratusphere Hub). The hub was then used to create a
series of “Comma Separated Values” (.csv) reports which have then been used to generate
graphs and summary tables of key information. In addition the Stratusphere Hub
generates a magic quadrate style scatter plot showing the Machine and IO experience of
the sessions. The Stratusphere hub was deployed onto the core network therefore its
monitoring did not impact the servers being tested.
The Stratusphere UX by User data shows that for almost all the tests 100% of users were
rated as having a Good Users experience and those users which had a fair user experience
were only just outside the Good category. It should be noted that total number of users
for each test run typically exceeds the number of desktops available, the reason for this is
that the Dell team found it was necessary to configure the Login VSI tool to launch more
sessions than were actually needed since there is always a percentage of the users that
fail to fully connect in every run, this is something that was noted by Login Consultants in
their documentation.
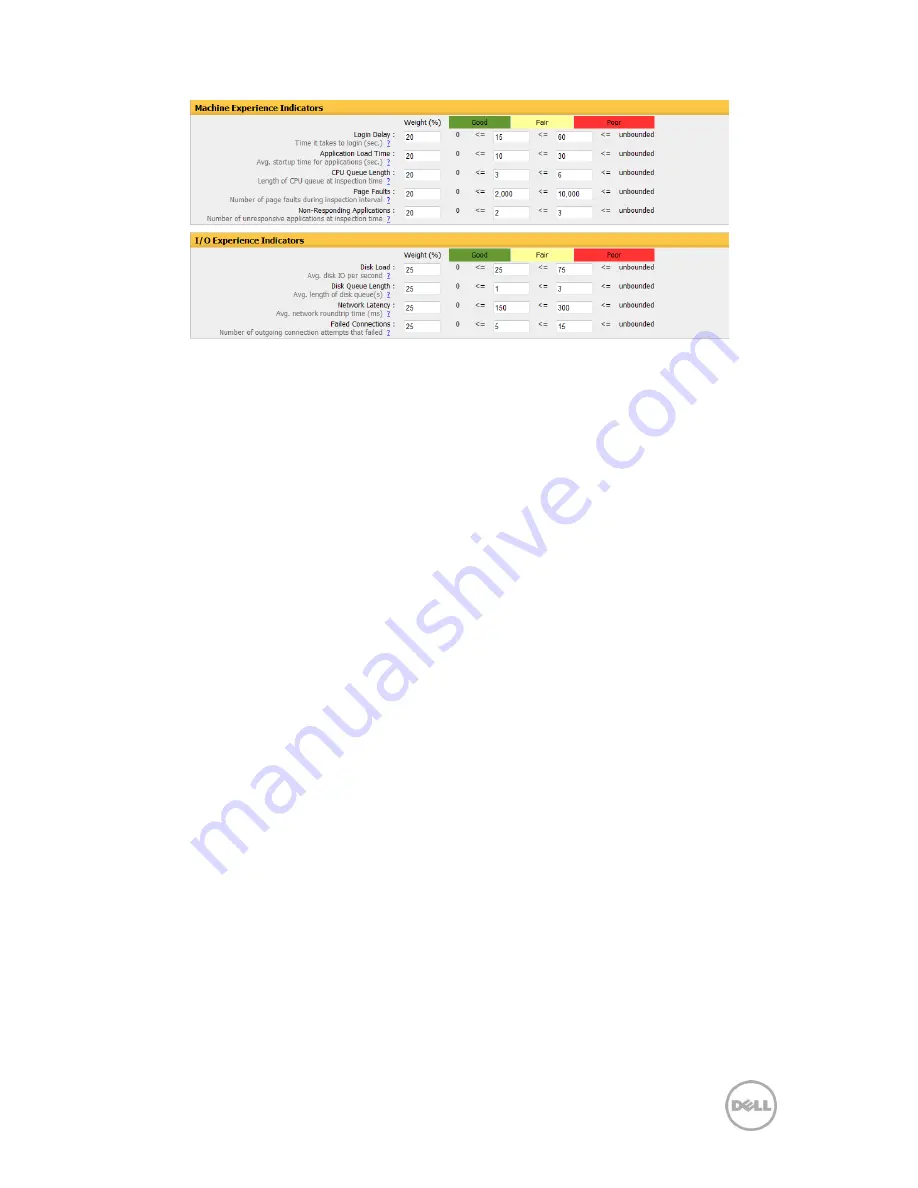
VDI UX is based on the following 9 metrics; User login, Application load time, CPU Queue,
Page faults, Disk IOPS, Disk Queue, Network latency, Non responding applications and
Incomplete connections.
Each time the ConnectorID (CID) in the VDI sessions sends a report, Stratusphere
associates a VDI UX score to the machine and the user logged in at the time. VDI UX
classification for a time period is compiled based on the VDI UX ratings received for each
CID (agent) report. So a few peaks could move a user overall rating from good to fair
although the average values observed for that same time period are below the fair
threshold.


