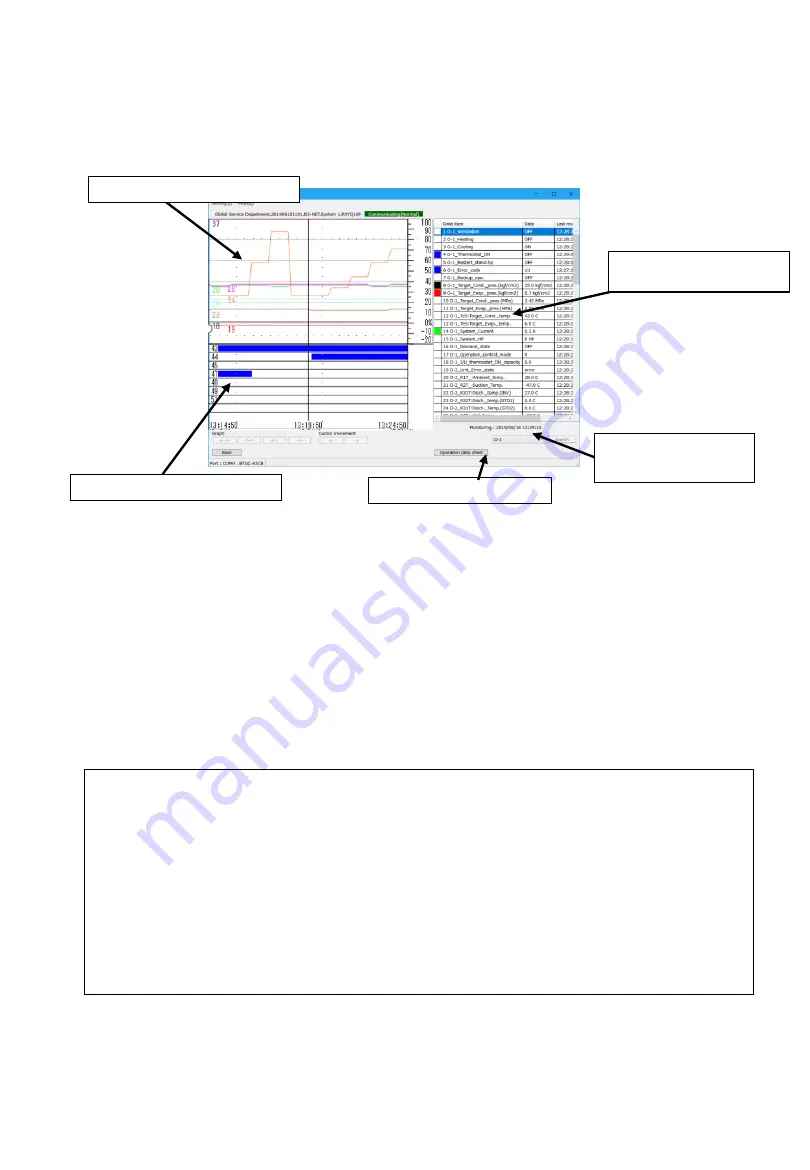
5-1-5 Operation data display
[Operation data display] screen
In [Network map display] screen, by pressing [Disp. op data] in [Display mode], operation data will be
shown for selected system. 1 screen per 1 system will be shown.
(3) Present value of each
parameter
(2) Digital data graph
(1) Analog data graph (upper left)
•
Showing time in horizontal axis, percentage from full scale (-20% - +100%) in vertical axis. The full scale value
of each parameter is shown in the right most column of present value chart in the right. Please check them by
scrolling the chart. At 100%, data is at full scale value.
•
Number and color of graphs are corresponding to the number and color of square (
□
) in the left most
column of present value chart in the right.
•
Up to 8 items per unit can be displayed.
(2) Digital data (ON/OFF status) graph (lower left)
•
In case of ON status, blue bar is shown.
•
Number of each bar corresponds to the number of each parameter of present value chart.
•
Up to 8 items per unit can be displayed.
You can jump to the other
unit in the same system
(1) Analog data graph
(4) Inspection sheet display
(Note) About cursor (vertical line in the graph)
1.
To display operation data from record mode, cursor is not displayed initially. The latest data is displayed
in each box in (3) present value chart.
2.
If a connected system is supported model by inspection sheet output function, by clicking on the graph
area (or cursor move button), cursor will be displayed and parameters at the time of cursor indicates
are shown in the (3) present value chart.
3.
If a connected system is not supported model by inspection sheet output function, cursor would not be
shown and status remains at 1.
4.
In case of showing operation data from display mode, cursor will be shown initially in the middle of
graph.
AS0112-P-DENV
28
https://daikin-p.ru


