


xStack
®
DGS-3600 Series Layer 3 Gigabit Ethernet Managed Switch
Switch Logs
The Web manager allows the Switch's history log, as compiled by the Switch's management agent, to be viewed.
To view the Switch history log, click
Monitoring
> Switch Logs
, as shown below.
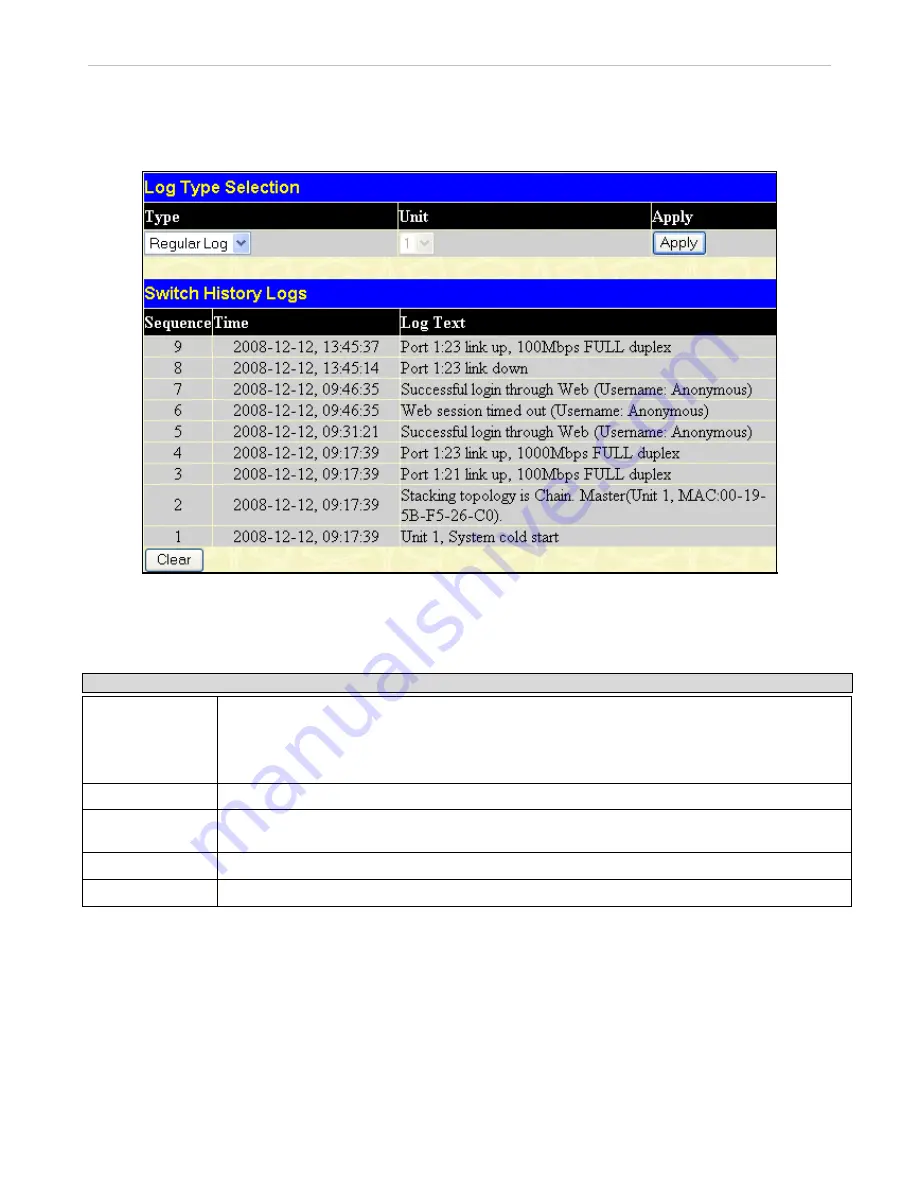
Figure 12- 49. Log Type Selection window
The Switch can record event information in its own logs, to designated SNMP trap receiving stations, and to the PC connected to
the console manager. Clicking
Clear
will allow the user to clear the Switch History Log.
The information in the table is categorized as:
Parameter Description
Type
Choose the type of log to view. There are two choices:
Regular Log
– Choose this option to view regular switch log entries, such as logins or firmware
transfers.
Attack Log
– Choose this option to view attack log files, such as spoofing attacks.
Unit
Enter the unit you wish to view.
Sequence
A counter incremented whenever an entry to the Switch's history log is made. The table displays
the last entry (highest sequence number) first.
Time
Displays the time in days, hours, and minutes since the Switch generated the log file.
Log Text
Displays text describing the event that triggered the history log entry.
Browse ARP Table
This window will show current ARP entries on the Switch. To search a specific ARP entry, enter an interface name into the
Interface Name or an IP address and click
Find.
To clear the ARP Table, click
Clear All.
To view the Browse ARP table, click
Monitoring
> Browse ARP Table
, as shown below.
371


