


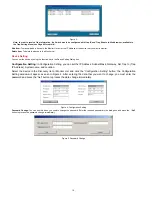
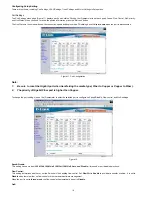
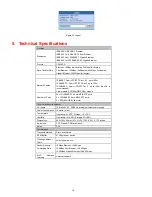

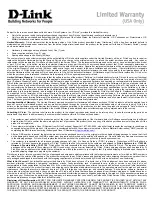
Figure 1. Web Management Utility
The Web Management Utility is divided into four parts,
Discovery List, Monitor List, Device Setting
, and
Toolbar function
. For detailed instruction,
follow the section below.
Discovery List
This is the list where you can discover all the D-Link Web-Smart devices in the entire network
By clicking on the
“Discovery”
button, you can list all the Web-Smart devices in the discovery list.
Double click or press the
“Add to monitor list”
button to select a device from the Discovery List to the Monitor List.
System word definitions in the Discovery List:
MAC Address:
Shows the device MAC Address.
IP Address:
Shows the current IP address of the device.
Protocol version:
Shows the version of the Utility protocol.
Product Name:
Shows the device product name.
System Name:
Shows the appointed device system name.
Location:
Shows where the device is located.
Trap IP:
Shows the IP where the Trap is to be sent.
Subnet Mask:
Shows the Subnet Mask set of the device.
Gateway:
Shows the Gateway set of the device.
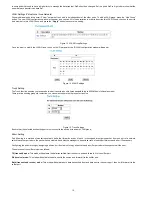
Monitor List
All the Web Smart Devices in the Monitor List can be monitored; you can also receive a trap and show the status of the device.
System word definitions in the Monitor List:
S:
Shows the system symbol of the Web-Smart device, represents that the device system is not alive.
IP Address:
Shows the current IP address of the device.
MAC Address:
Shows the device MAC Address.
Protocol version:
Shows the version of the Utility protocol.
Product Name:
Shows the device product name.
System Name:
Shows the appointed device system name.
Location:
Shows where the device is located.
Trap IP:
Shows the IP where the Trap is to be sent.
Subnet Mask:
Shows the Subnet Mask set of the device.
Gateway:
Shows the Gateway set of the device.
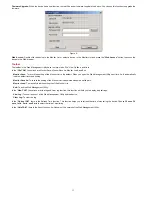
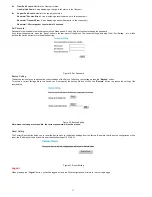
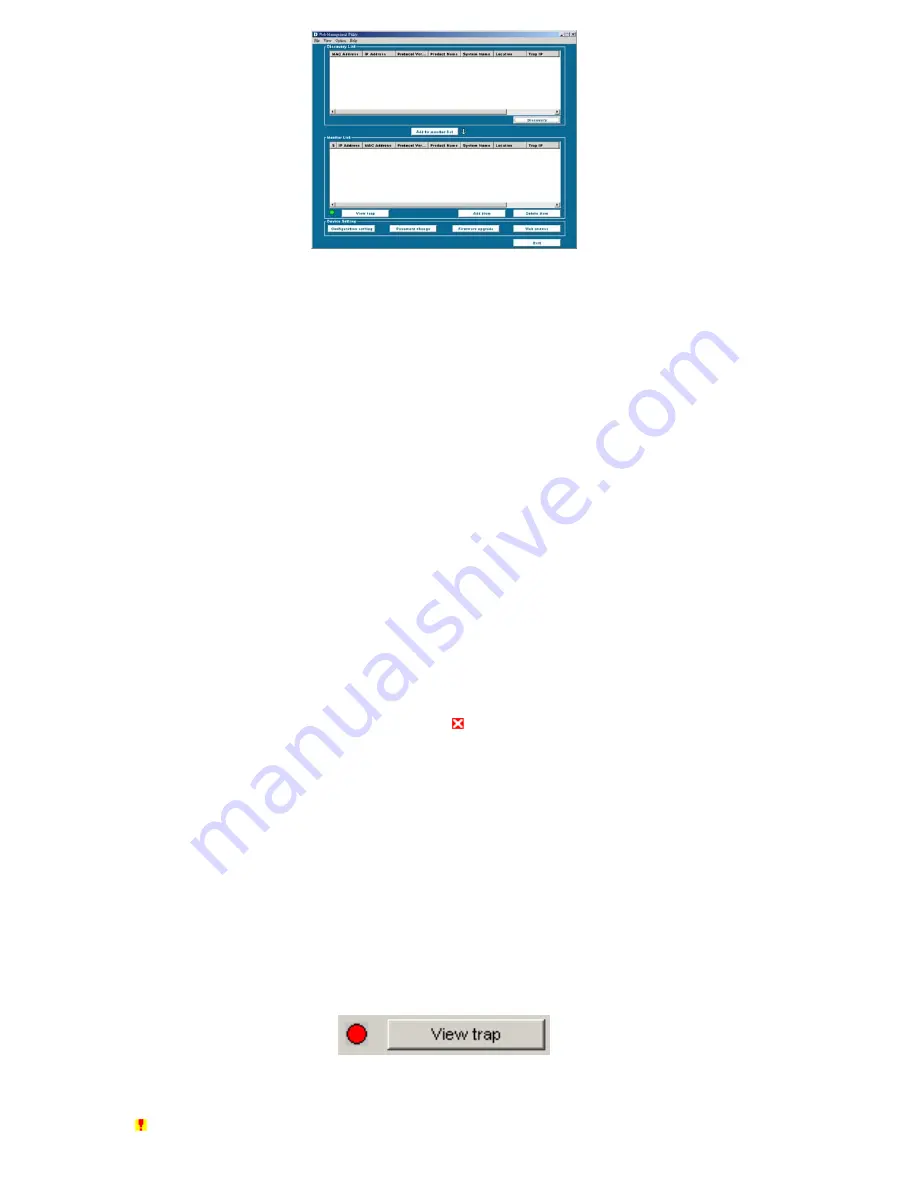
View Trap:
The Trap function can receive the events that occur from the Web-Smart Switch in the Monitor List.
There is a light indicator behind the
“View Trap”
button. When the light is green, it indicates that no trap has been transmitted, and when it is red, it
indicates that a new trap has been transmitted, reminding us to view the trap. (Figure 2)
Figure 2.
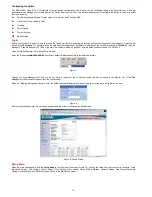
When the
“View Trap”
button is clicked, a Trap Information window will pop up, displaying trap information including the Symbol, Time, Device IP,
and the Event occured. (Figure 3)
The symbol “
” represents the trap signal; this symbol will disappear after you review and click on the event record.
9
Summary of Contents for DES-1226G
Page 13: ...Figure 10 Setup menu 13 ...
Page 29: ...29 ...


