5
The blood pressure increases with the age. The rule of thumb for the normal systolic
pressure is the formula 100 + age.
Blood pressure values are rounded to 5 mmHg.
Calculating the blood pressure in the Coach software
The blood pressure cannot be read directly from the measurement graph. A detailed
description of the data processing is given in this chapter.
The result of the measurement with the Blood pressure sensor is a pressure - time graph in
which the pressure pulses of the blood are superposed on the decaying trend pressure of the
cuff. The pressure pulses, when extracted from the cuff pressure, form an oscillating
waveform. The peak-to-peak amplitudes of this waveform create a bell shaped “envelope
curve” vs. pressure. Within the envelope, the pulse amplitudes increase through the
systolic blood pressure and continue increasing until a maximum amplitude (Mean Arterial
Pressure - MAP), is reached. After that the pulse amplitudes decrease further until hardly
noticeable.
Generally, the systolic blood pressure is calculated by determining the point along this
bell-shaped envelope for which p>MAP using a known percentage of the maximum
amplitude (usually 50%). Diastolic blood pressure is calculated using the same method and
the portion for p<MAP (usually 75%). These percentage values are obtained from
empirical research.
2
The bell shaped “envelope curve” is extracted from the measurement graph as the
difference graph of the pulse pressure graph (the maximal values of the pressure pulses)
and the trend pressure graph.
Important:
Save your original blood pressure
measurements. These are needed for the
data processing.
Determination of the cuff pressure
1.
Determine the number of the
measured points in your
measurement (from the
Measurement settings or from the
Measurement table).
2.
Select in the diagram window menu
the
Process > Select/Remove data
option
.
3.
Select the method
Point-by-point
.
4.
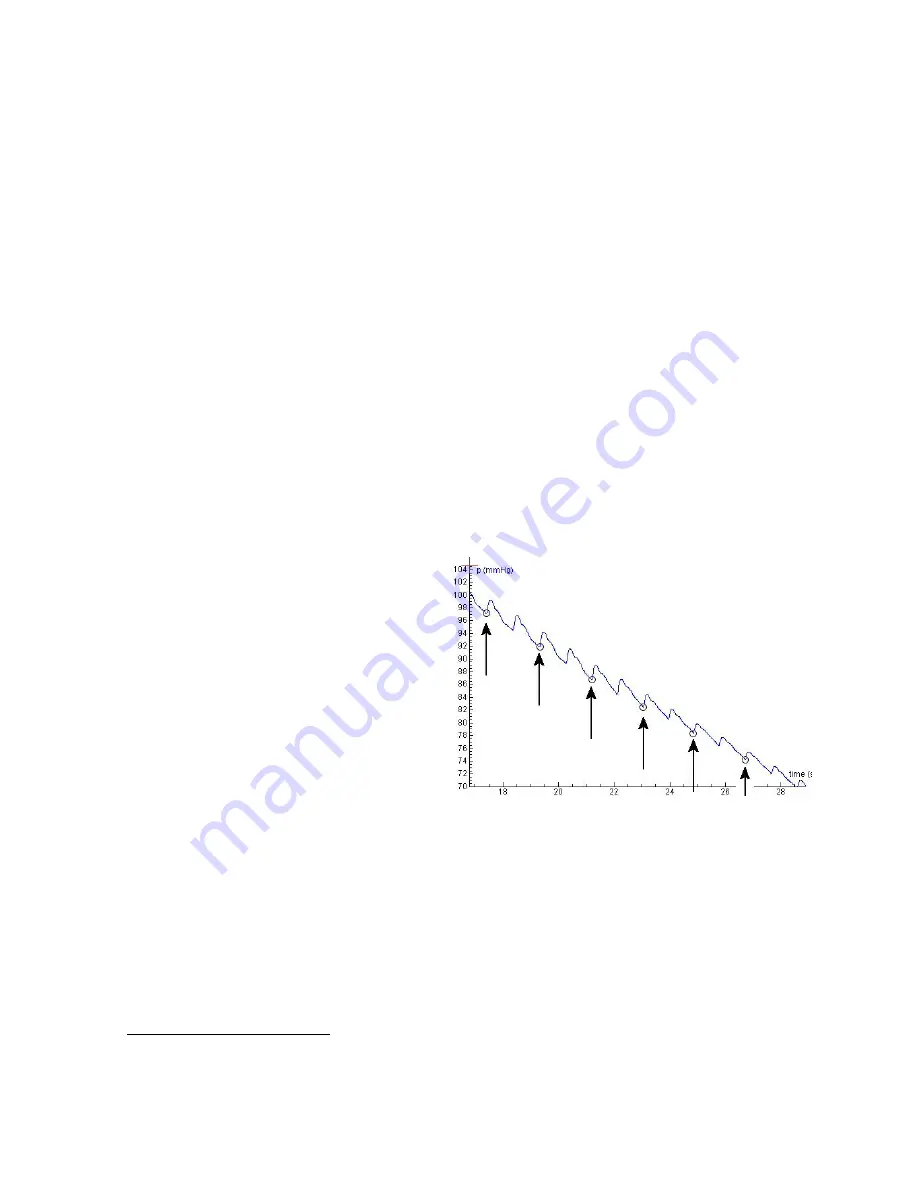
Mark the very first point, very last point and points where the pressure values are
locally minimal. These points indicate the graph of the deflating pressure trend of the
cuff (i.e. without the pulses). It is enough to take every second minimum (see figure 4).
Tip:
Use the cursor key to go through points. Find the point where the pressure value
2
Mehlsen J et al (1999). Vejledende retnigslinier for hjemmeblodtryksmåling. Ugesk Læ Klaringsrapport
nr. 8, 1999. Online beschikbaar op http://www.hypertension.suite.dk/klar899.pdf
Figure 4.
Select the points at which the pressure value
is minimal, just before the pressure signal rises again.


