


Appendix
Appendix 2 Time Domain Measurement
334
Appendix 2 Time Domain Measurement
●
Recording or Saving of Data
······················································································
●
Resolution and range of time measurement
······································································
●
Window filtering
···································································································
●
Time gate filtering
·································································································
●
Time domain measurement data
··················································································
●
Band-pass and Low-pass Time Domain Mode
··································································
●
Setting of time domain transformation measurement
···························································
2.1 Principle of Time Domain Measurement
If the analyzer is configured with the time domain option, you can observe the device response in the time domain.
The analyzer displays the response of the DUT with frequency changes in general measurement. This is referred to
as the frequency domain measurement. However, in the time domain measurement, the frequency domain data are
subject to inverse Fourier transformation into the time domain data, the measurement results are displayed with the
time as the X-axis, the response values appear at the discrete time points, and the characteristics and limitations of
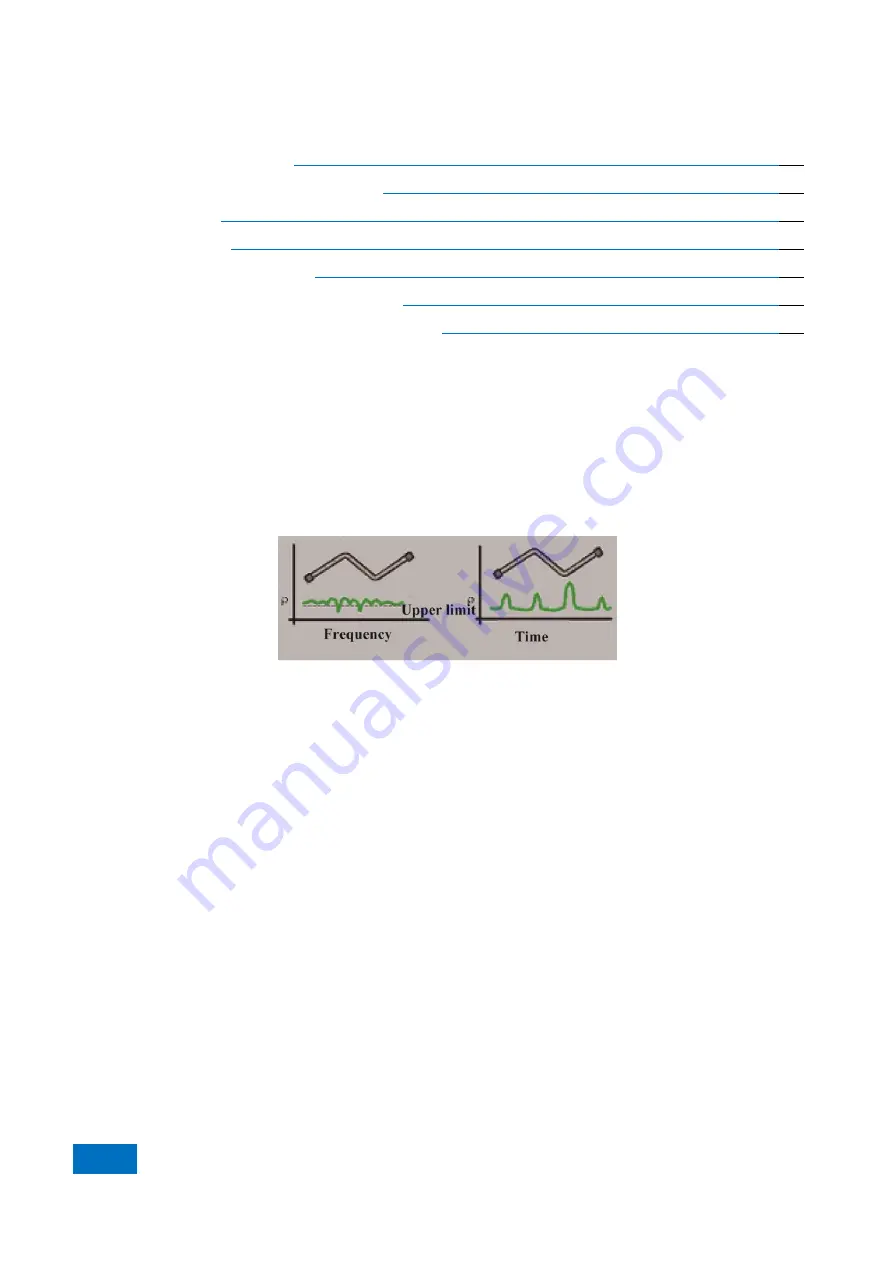
the DUT can be analyzed. The following figure shows the frequency domain and time domain reflection
measurement results of the same cable with two bends. Each bend may result in transmission line mismatching or
impedance change.
Fig. 2.1 Frequency Range and Time Domain Measurement
1) The S11 frequency range response measured at the input port shows the combined reflection response arising
from mismatching of the cable with wave interactions. The exact physical location of cable mismatching cannot be
determined easily.
2) The time domain response shows the location and degree of each mismatch. It can be seen that the second bend
of the cable mismatches obviously.
In the time domain, the gate function can be used to filter undesired response, followed by transformation of time
domain data into frequency range data. This function can be used to measure the response of specific signals in the
measurement network and remove the influence of external devices such as the connector or adapter.
The traditional time domain reflectometer (TDR) can be simulated by the time domain measurement function. Use
TDR to send an impact or step signal to the DUT. Observe the reflected signal energy. The impedance change of
the DUT can be determined by analyzing the amplitude, duration and waveform of the reflected signal. Actually,
the incident impact or step signal is not produced by the network analyzer. Instead, frequency sweep measurement
is done, and the time domain information is calculated by the Fourier algorithm based on the frequency domain
measurement results. So far, the time domain transformation is measured with the S
11
ratio for the majority of
universal network analyzers. S
11
reflection measurement is not simply to display the reflected signal measured by
Receiver A or B. Instead, the measurement result of the ratio between the measurement receiver and reference
receiver is displayed. In addition, system errors can be eliminated by calibration in the S
11
ratio measurement. This
is particularly important to time domain measurement. The measurement reference plane is established by
calibration, and the calibration point is the zero point of the X-axis (time) and used as the reference point for all the
time and distance data. Due to calibration, the time and amplitude data are accurate. The steps of time domain
measurement of the analyzer are as follows:
1) Collect the data of the original receiver (A and R).
Summary of Contents for AV3672 Series
Page 3: ......
Page 4: ...AV3672 Series Vector Network Analyzer Contents...
Page 5: ......
Page 124: ...5 Menu 5 1 Menu structure 120 5 1 2 Track Fig 5 2 Track Menu...
Page 125: ...5 Menu 5 1 Menu structure 121 5 1 3 Channel Fig 5 3 Channel Menu...
Page 126: ...5 Menu 5 1 Menu structure 122 5 1 4 Excitation Fig 5 4 Excitation Menu I...
Page 127: ...5 Menu 5 1 Menu structure 123 Fig 5 5 Excitation Menu II...
Page 128: ...5 Menu 5 1 Menu structure 124 Fig 5 6 Excitation Menu III...
Page 129: ...5 Menu 5 1 Menu structure 125 5 1 5 Response Fig 5 7 Response Menu I...
Page 130: ...5 Menu 5 1 Menu structure 126 Fig 5 8 Repsonse Menu II...
Page 131: ...5 Menu 5 1 Menu structure 127 Fig 5 9 Response Menu III...
Page 132: ...5 Menu 5 1 Menu structure 128 Fig 5 10 Response Menu V Fig 5 11 Response IV...
Page 133: ...5 Menu 5 1 Menu structure 129 5 1 6 Calibration Fig 5 12 Calibration Menu...
Page 134: ...5 Menu 5 1 Menu structure 130 5 1 7 Marker Fig 5 13 Cursor Menu I...
Page 135: ...5 Menu 5 1 Menu structure 131 Fig 5 13 Cursor Menu II...
Page 136: ...5 Menu 5 1 Menu structure 132 Fig 5 15Marker Menu III...
Page 137: ...5 Menu 5 1 Menu structure 133 5 1 8 Analysis Fig 5 16 Analysis Menu I...
Page 138: ...5 Menu 5 1 Menu structure 134 Fig 5 17 Analysis Menu II...
Page 139: ...5 Menu 5 1 Menu structure 135 Fig 5 18 Analysis Menu III...
Page 140: ...5 Menu 5 1 Menu structure 136 5 1 9 System Fig 5 19 System Menu I...
Page 141: ...5 Menu 5 1 Menu structure 137 Fig 5 20 System Menu I...
Page 254: ...8 Basis of Network Measurement 8 3 Amplifier Parameter Specifications 250...
Page 257: ...8 Basis of Network Measurement 8 4 Complex Impedance 253...
Page 373: ...Appendix Appendix 4 Pulse Measurement 369 Fig 4 9 Receiver gain configuration Dialog Box...


