background image

Optional: 

Visual Inspection 

of Counting Gates

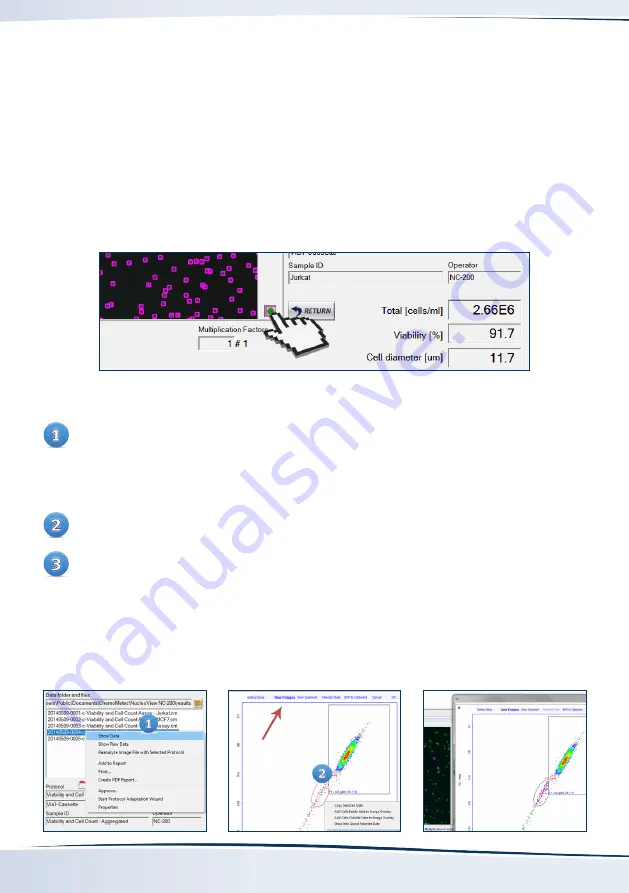
Option One (Preferred)

Click the green dot in the right-hand corner of the image window.


This activates the image overlay function indicating all the events in the total cell count. The mouse 

scroll button allows the user to zoom in at the cursor position. Cells will be framed by a pink square.

Option Two (Advanced)

Right-click on the sample file name in the ‘Data folders and files’  window and select ‘Show Raw 

Data’. A new window will open displaying scatter plots and histograms of event intensity and 

area for the appropriate channels (Acridine Orange and DAPI). It is important that the center 

of the population, most usually seen as a colored region on the scatter plot, is included in the 

counting gate. 

To check distinct cell populations, create a new polygon around the particular cell population.

Right-click  inside  of  the  newly  formed  polygon  and  select  ‘Add  Cells  Inside  Gate  to  Image 


Overlay’.  This  activates  the  image  overlay  function  indicating  all  the  events  visually  to 


determine the validity of their inclusion or exclusion from the final counting result.

Delete the polygon and the image overlay by right-clicking and selecting ‘Delete Image Overlay’.

Summary of Contents for NucleoCounter NC-200

Page 1: ...Quick Guide to the easiest cell count ever using Reagent A100 Reagent B NucleoCounter NC 200...

Page 2: ...file for detailed installation instructions Open the Install NucleoView NC 200 X X X X exe file the Xs indicate the version number e g 1 4 3 0 Do NOT open the bin file Follow the instructions on the...

Page 3: ...d will address your case as a top priority Our FAS are certified and expertly trained to identify isolate and resolve even the most challenging issues You have direct access to our FAS during office h...

Page 4: ...the mixture of cell suspension and Reagent A100 add 100 l of Reagent B and mix by pipetting i e Cell Sample Reagent A100 B should be mixed in a ratio of 1 1 1 Immediately load your sample into a Via1...

Page 5: ...ct the parameters that will be visible on the report and the properties of the parameters Optional Preview your result Save and or print your report to the default printer Tip Batch exports can be don...

Page 6: ...plots and histograms of event intensity and area for the appropriate channels Acridine Orange and DAPI It is important that the center of the population most usually seen as a colored region on the sc...

Page 7: ...tion Wizard or right click on the desired file and select Start Protocol Adaption Wizard Follow the instructions in the Protocol Adaptation Wizard to create your own adapted protocol The viability and...

Page 8: ...these documents or from the use of the information contained herein ChemoMetec A S reserves the right to make changes in the product design without reservation and without notification to its users Co...

Reviews: