background image


12. CAPACITY & RESOLUTION 


Range by Unit (Resoluti


on)


Model


N-m


N-cm


kgf-cm


in-lbf


ft-lbf


TTC-I-2


0.0020-2 (0.0002)


0.20 -200 (0.02)


0.020 - 20 (0.002)


0.025 - 17.7 (0.002)


0.0020 - 1.48 (0.0002)


TTC-I-5


0.0050 - 5 (0.0005)


0.50- 500 (0.05)


0.050 -50 (0.005)


0.045 - 43.3 (0.005)


0.0040 - 3.7 (0.0005)


TTC-I-10


0.010 - 10 (0.001)


1.0 - 1000 (0.1)


0.10  - 100 (0.01)


0.09 - 88.5 (0.01)


0.007 - 7.4 (0.001)


TTC-I-20


0.020- 20 (0.002)


2.0- 2000 (0.2)


0.20 -200 (0.02)


0.18 - 177 (0.02)


0.014 - 14.8 (0.002)


TTC-I-50


0.050 - 50 (0.005)


5.0 - 5000 (0.5)


0.50 - 500 (0.05)


0.45 - 443 (0.05)


0.035 - 36.8 (0.005)


TTC-I-100


0.10 - 100 (0.01)


10- 10000 (1)


1.0 -1000 (0.1)


0.9 - 885 (0.1)


0.07 - 74 (0.01)


TTC-E-200


0.20 - 200 (0.02)


-


2.0 -2000 (0.2)


1.8 - 1770 (0.2)


0.14 - 148 (0.02)


TTC-E-500


0.50- 500 (0.05)


-


5.0 -5000 (0.5)


4.5 -4425 (0.5)


0.35 - 368 (0.05)


TTC-E-800


1.6 - 800 (0.1)


-


16 -8000 (1)


14 -7080 (1)


1.1 - 590 (0.1)


Summary of Contents for TTC Series

Page 1: ...separate peak readings from programmed decreases Preset operation with programmable tolerance thresholds for quick pass fail tool test is available in all modes The analog bar graph on the backlit reversible LCD aids users by providing the resultant torque s current position compared to the full scale range along with the direction of the force Pass fail icons produce live test feedback allowing i...

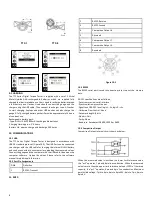
Page 2: ... 9 Units Indicator Selected engineering unit 10 Statistics X Average R Variance 11 Data list Five Point Measurement in Peak First Peak Modes12 Key Setting Mode Printer Icon Key press will print Disc icon key will store reading 13 Double Peak Mode Percentages 14 Sensor Icons TTC E Only Sensor is Connected Sensor not Connected Track Real Time live measuring mode Peak Reading will not change until a ...

Page 3: ... value 4 MENU STRUCTURE Menu Measurement Unit Group Test Mode Capacity TTC E Only Preset Memory Browse Print All Print Select Upload Delete Select Delete All System Display Mode Auto Power Off Backlight Key Tone Language Date Time Diagram Scale Key Setting Display Direction Default Information Calibration Torque Sensitivity Weight Force 5 ADVANCED MENU OPTIONS 5 1 Measurement The Measurement menu ...

Page 4: ...e peak value after programmed time has elapsed Double Peak Mode will display a dual drop ratio settings menu This will enable two separate peak values to be recorded 5 5 Capacity TTC E Only The TTC E with external sensor when set to Auto the display will automatically detect the proper range of the sensor If any uncertainty or in special circumstance you may select the sensor range in the list 5 6...

Page 5: ...deleted Touch MODE UP to adjust the value Press SAVE PRINT to shift to the next position Touch ZERO EXIT to cancel touch MENU ENTER to confirm 6 6 Delete All In this menu a prompt will appear All data will be deleted by selecting YES and canceled by selecting NO or pressing ZERO EXIT 7 SYSTEM Under the System menu several parameters may be set 7 1 Display Mode Two display modes may be selected Dig...

Page 6: ...the current displayed value Press MODE UP or DOWN to select the proper setting Press LOG to cancel touch MENU ENTER to confirm and exit 7 9 Display Direction Select the mode of the LCD display Automatic Obverse or Reverse Touch MODE UP or DOWN keys to shift to the next position Press ZERO EXIT to cancel Push MENU ENTER to confirm and exit 7 10 Default Setting If you make a selection that you feel ...

Page 7: ...andard torque this mode calculates the value properly to calibrate the instrument The torque generated by weights on a lever L is associated with the local gravity acceleration g that the user inputs TTC I TTC E Input in the standard lever length L gravity g and weight values by pressing MODE UP to adjust the value touch SAVE PRINT to shift to the next position Press MENU ENTER to view the next av...

Page 8: ...g the measured values Connect the gauge and the computer with the USB cable then open the computer software Upload the values Please refer to the software manual for additional information 10 2 Port Pin Assignments PIN Definition 1 RS232 Transmit 2 RS232 Receive 3 RS232 Ground 4 Comparison Output B 5 Reserved 6 Comparison Output C 7 Comparison Output A 8 Reserved Figure 10 2 10 3 RS232 The RS232 s...

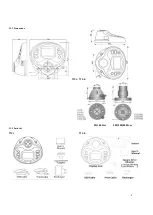
Page 9: ...9 11 1 Dimensions TTC I TTC E 50 100 N m 200 500 800 N m 11 2 Parts List TTC I TTC E ...

Page 10: ... 001 1 0 1000 0 1 0 10 100 0 01 0 09 88 5 0 01 0 007 7 4 0 001 TTC I 20 0 020 20 0 002 2 0 2000 0 2 0 20 200 0 02 0 18 177 0 02 0 014 14 8 0 002 TTC I 50 0 050 50 0 005 5 0 5000 0 5 0 50 500 0 05 0 45 443 0 05 0 035 36 8 0 005 TTC I 100 0 10 100 0 01 10 10000 1 1 0 1000 0 1 0 9 885 0 1 0 07 74 0 01 TTC E 200 0 20 200 0 02 2 0 2000 0 2 1 8 1770 0 2 0 14 148 0 02 TTC E 500 0 50 500 0 05 5 0 5000 0 5...

Reviews: