


Sound Level Meter
15
It will transfer first data set to graph and tabular on the right hand side every
time after you load recorded data from the Sound Level Meter and you can
click at any data set to change the set for graph.
On the right hand side sets the waveform graph and statistic information of the
data set you choose as refer to the graph.
Tutorial - Quick Start to Use SE390
(1.) Recording real time data in waveform.
1. Power on the Sound Level Meter first and connect it to a PC RS-232 serial
port wit the cable.
2. Start SE390 program.
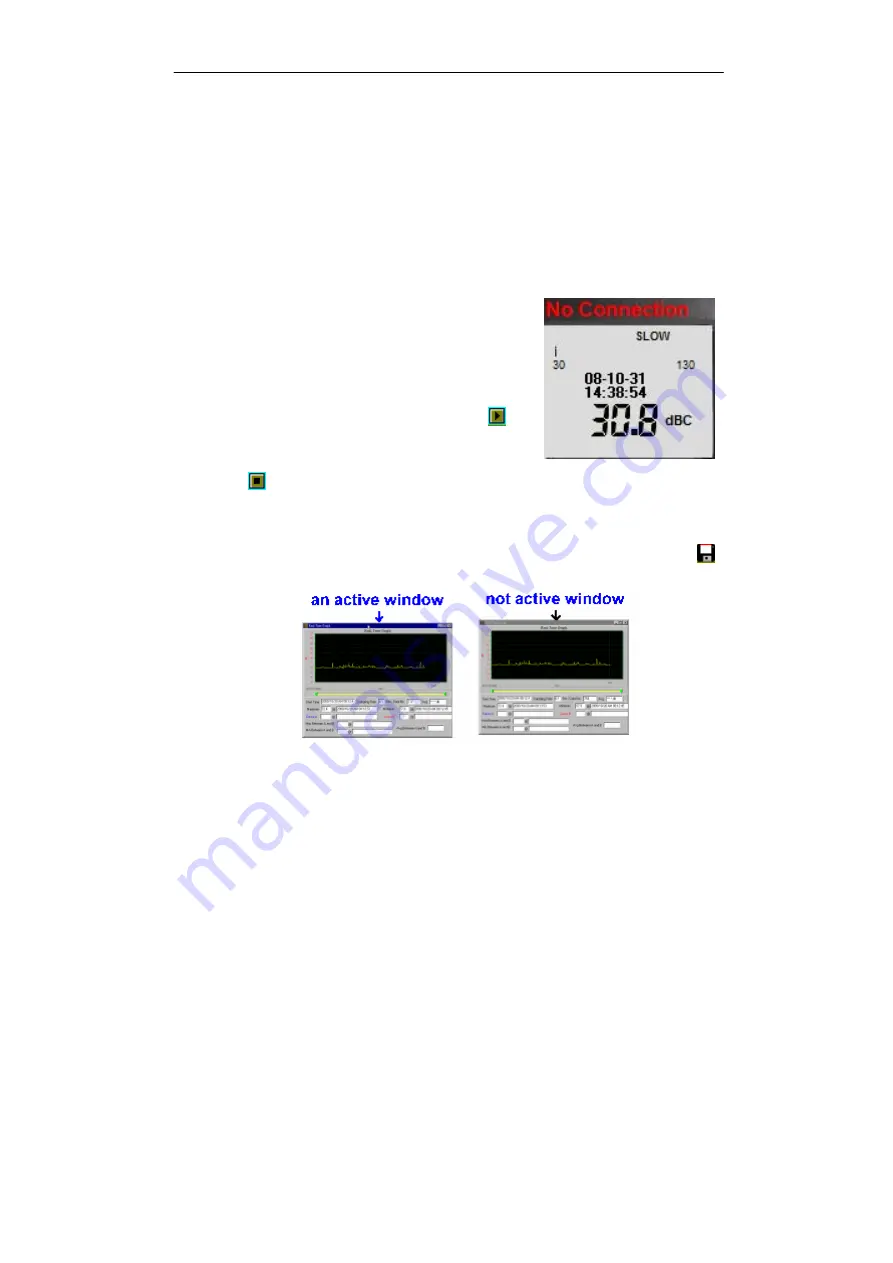
3. If the connection is successful the panel will
display the same value as the Sound Level Meter.
If fail to connect the meter with PC, it will display
"No Connection" on the panel window in SE390.
4. When the connection is successful, click
to
start recording real time data and there will be a
waveform on the Real Time Graph Window.
5. Click
to start recording.
(2.) How to save the recorded real time data to a file?
1. Click the graph window you want to save and the graph window will
become active , then choose File | Save from main menu or click
from the tool bar .
2. There will be a save dialog window for you to choose the file name and
file type to save. There are three types of file name you can choose,
binary file(*.ghf), text file(*.txt) and EXCEL format file(*.csv). The *.ghf file
use much fewer disk space to save the data than the other two file